
Time robustness
Instead of looking at the backtest as a single block, it splits it into consecutive sub-periods and looks at how it behaves in each. It serves to understand whether the strategy has been consistent over time or whether all the gain comes from a single lucky period.
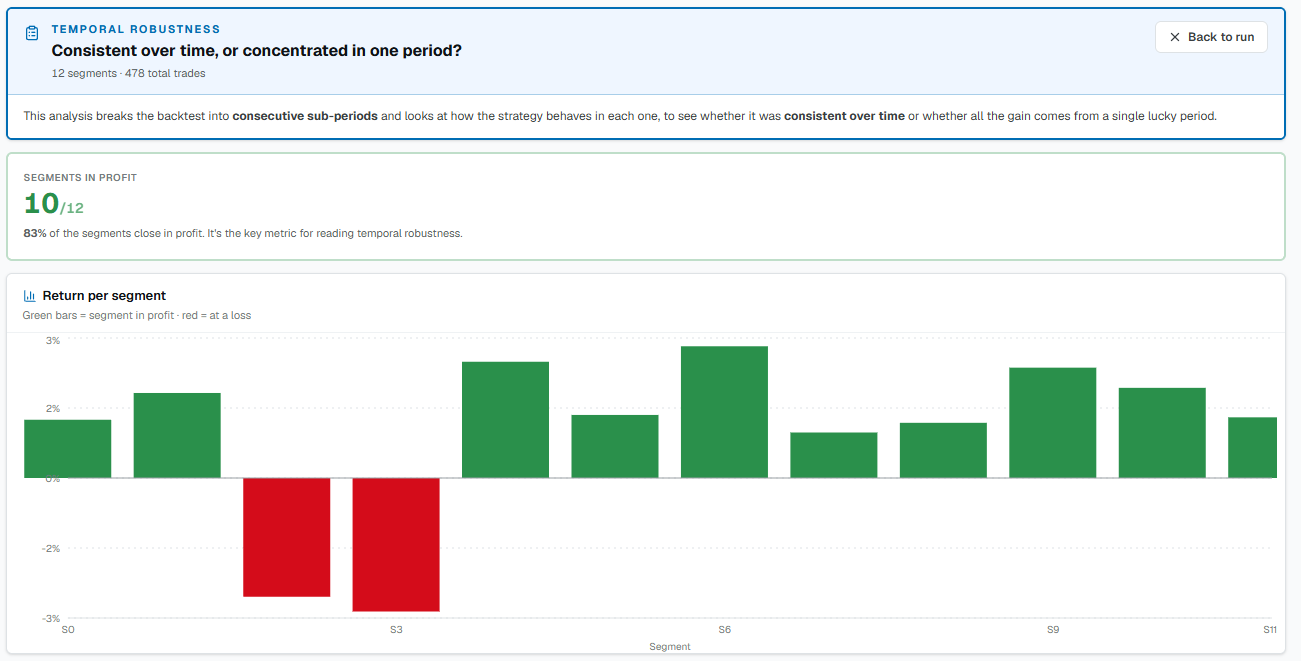
The key metric: % of profitable segments
This is the number to look at first. If the strategy is profitable in almost all segments it is robust; if it gains only in a few, the result rests on a lucky window — a warning sign of fragility.
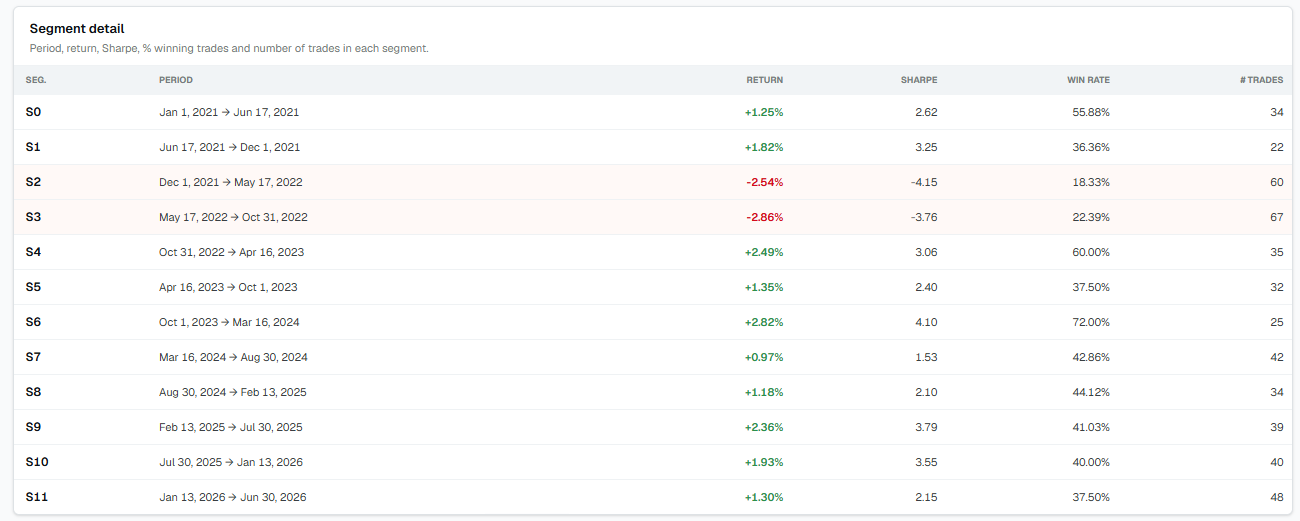
Per segment
For each period you see return, Sharpe, percentage of winning trades and number of trades. How much these values vary from one period to another tells you how stable the strategy is.
The outcome
Automatic verdicts generated from the numbers above (default thresholds, to be recalibrated with use), plus a quick map on how to read segments, % profitable and dispersion.
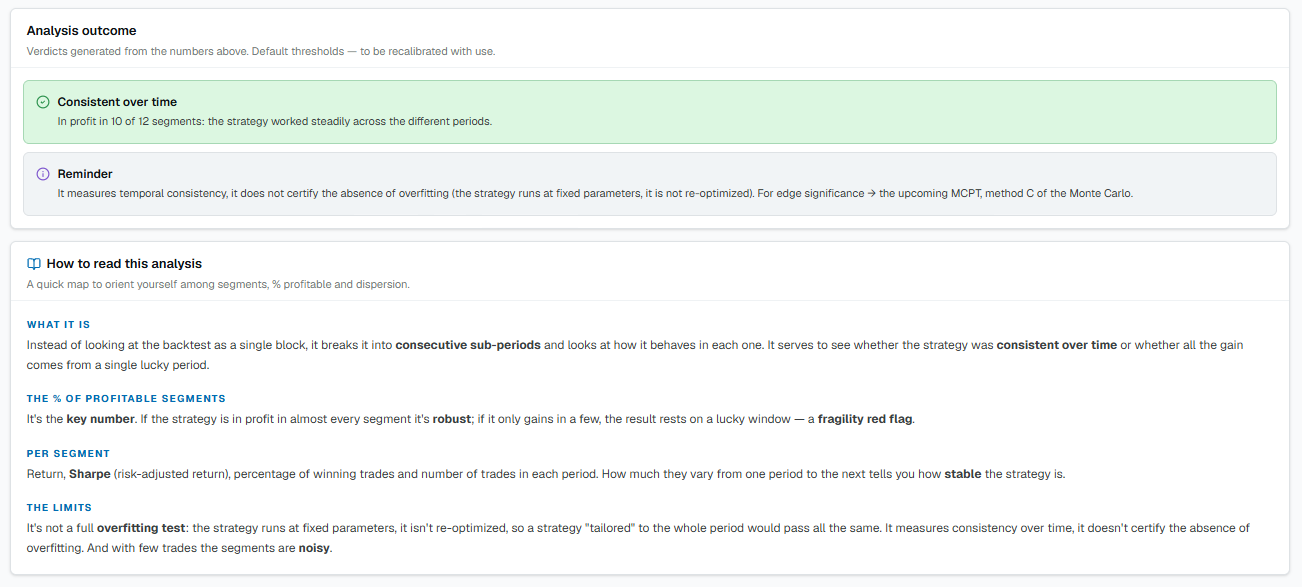
The limits. It is not a complete overfitting test: the strategy runs at fixed parameters, it is not re-optimized, so a strategy "tailored" to the whole period would pass anyway. It measures consistency over time, it does not certify the absence of overfitting. And with few trades the segments are noisy.