
Historical stress test (portfolio)
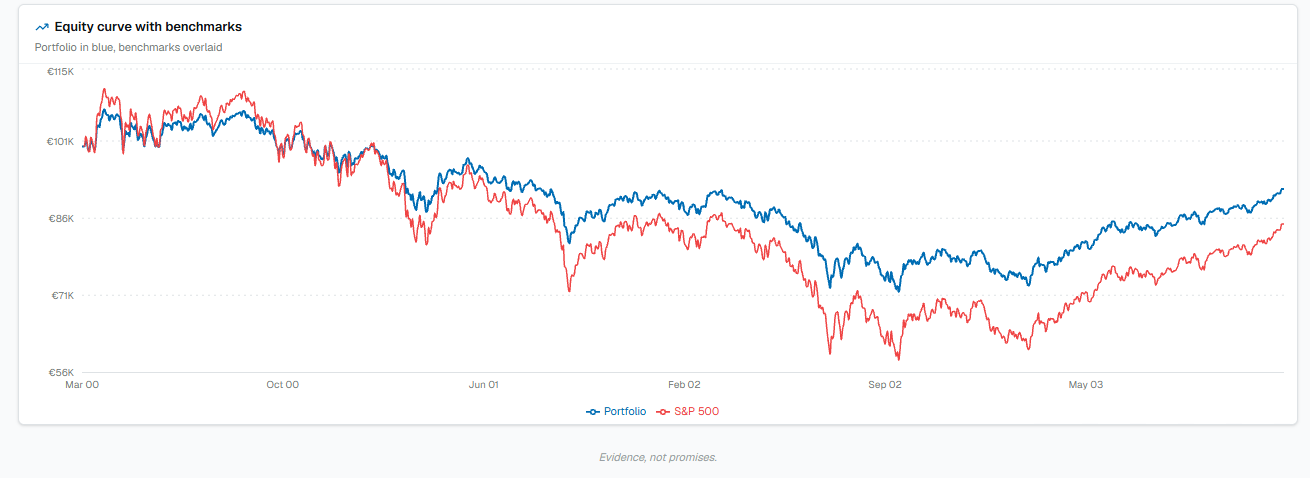
The stress test launches the portfolio on a real historical crisis window to see how it holds up in the worst market moments. Components that have no data for that period are replaced by the benchmark of their asset class (proxy).
The scenarios
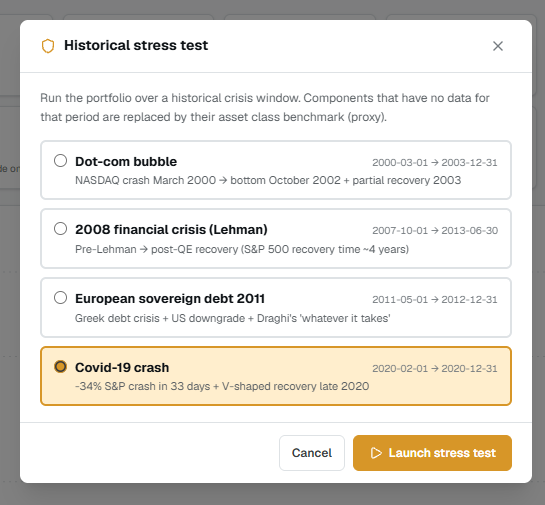
Choose a historical crisis among those available:
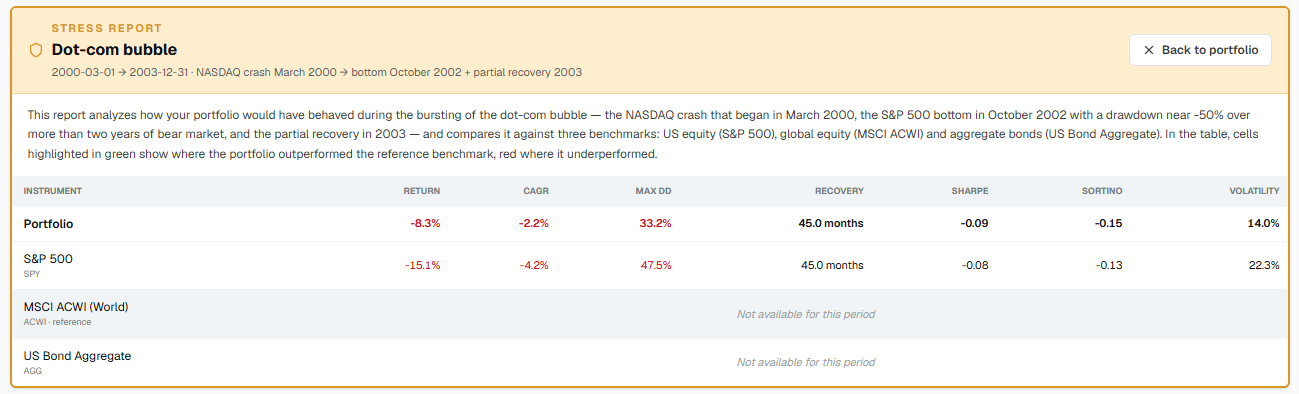
- Dot-com bubble — NASDAQ crash from March 2000, bottom October 2002, partial recovery 2003.
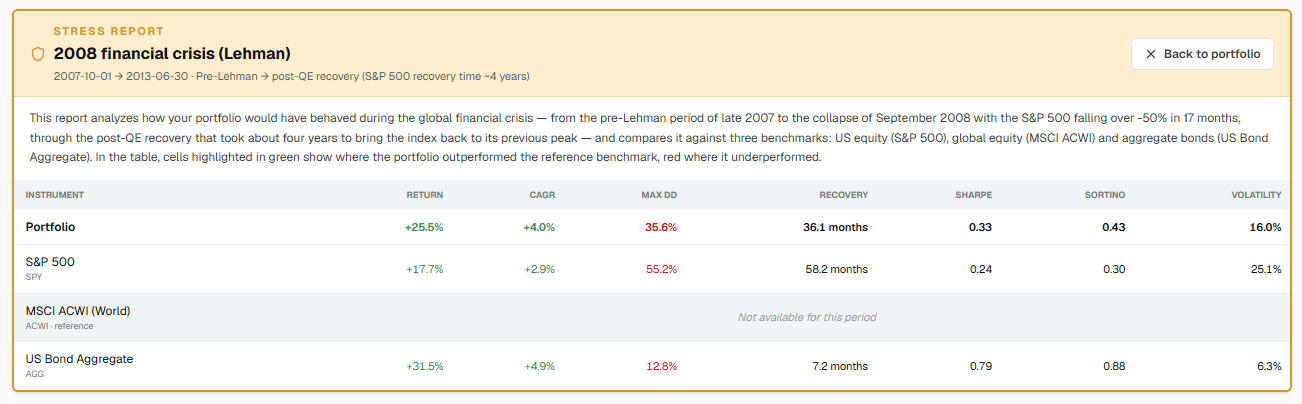
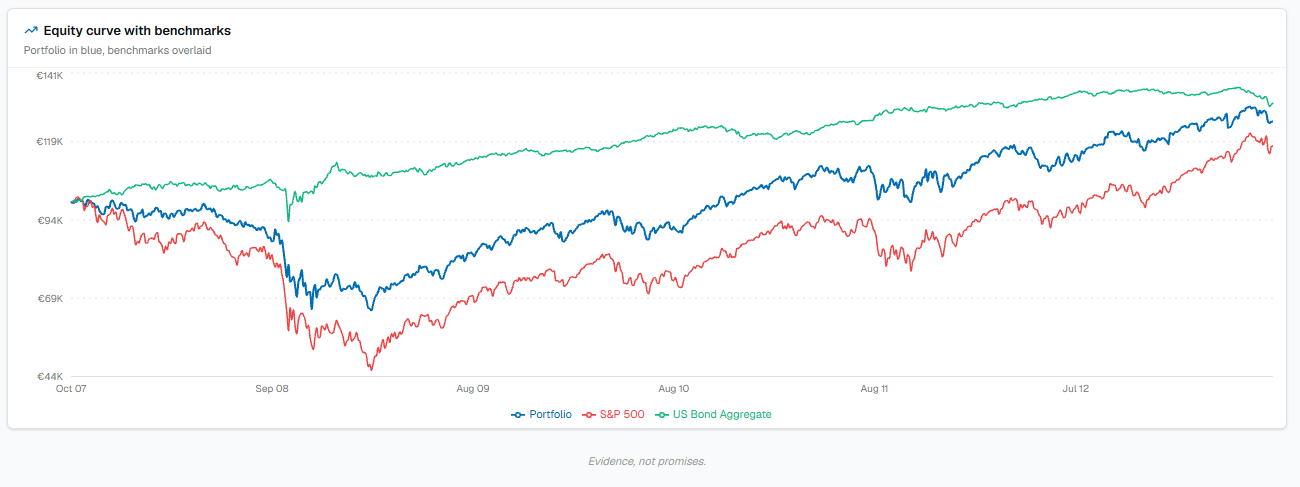
- 2008 financial crisis (Lehman) — pre-Lehman, post-QE recovery.
- European sovereign debt 2011 — Greek debt crisis, US downgrade, Draghi's "whatever it takes".
- Covid-19 crash — the S&P's -34% in 33 days and the V-shaped recovery of late 2020.
How to read the results
For the chosen scenario you see how the portfolio would have behaved during that crisis — maximum loss, drawdown, recovery — compared with the benchmark. It is the way to understand whether diversification and hedges hold up when the market really goes bad, not just in normal conditions.
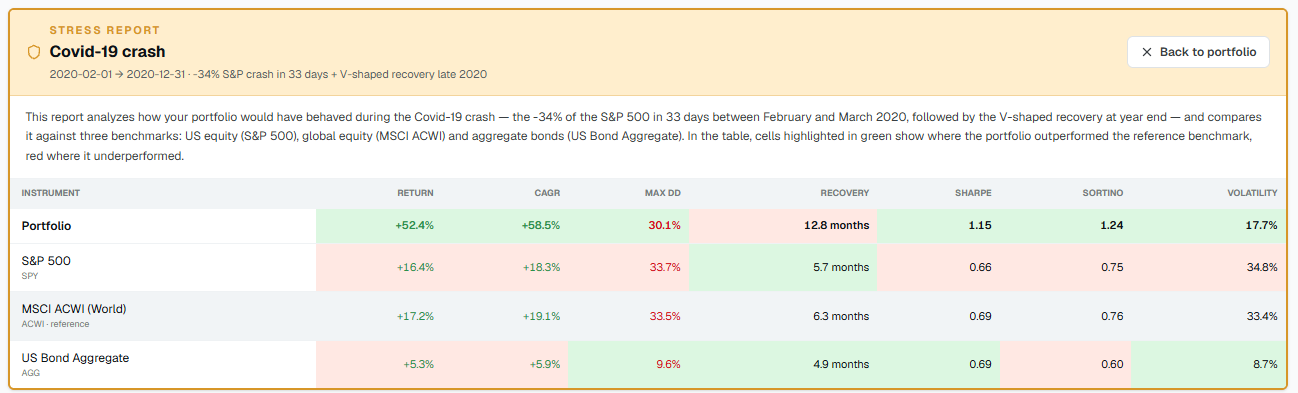
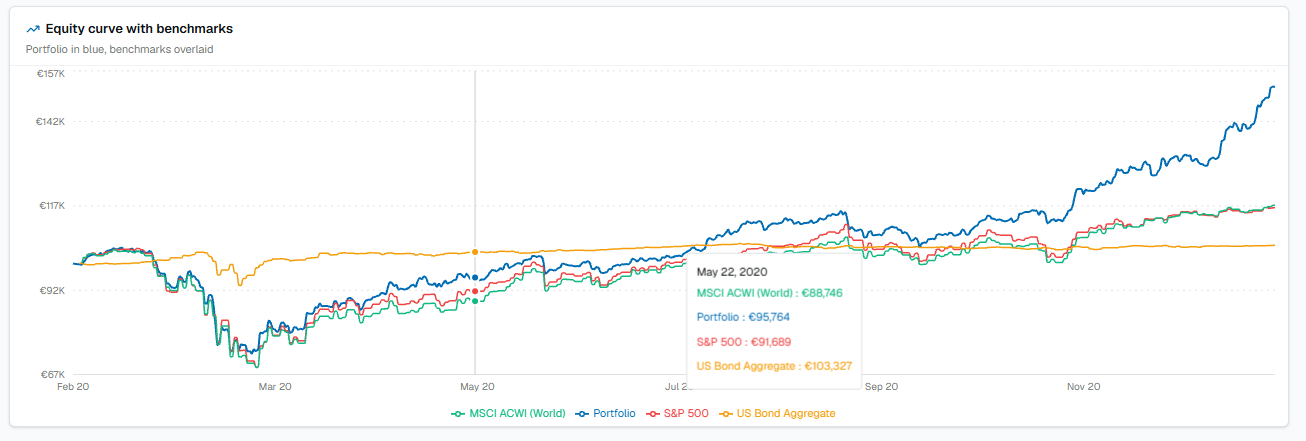
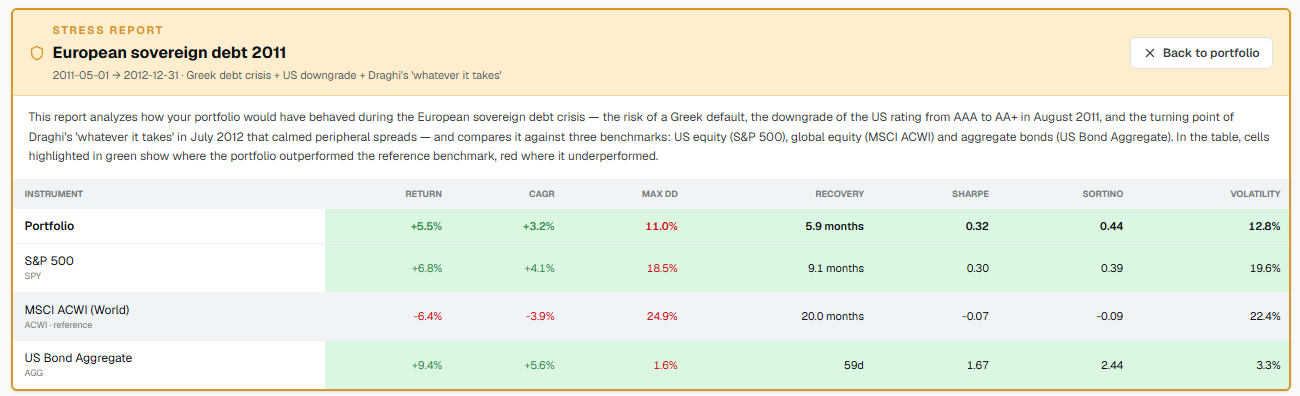
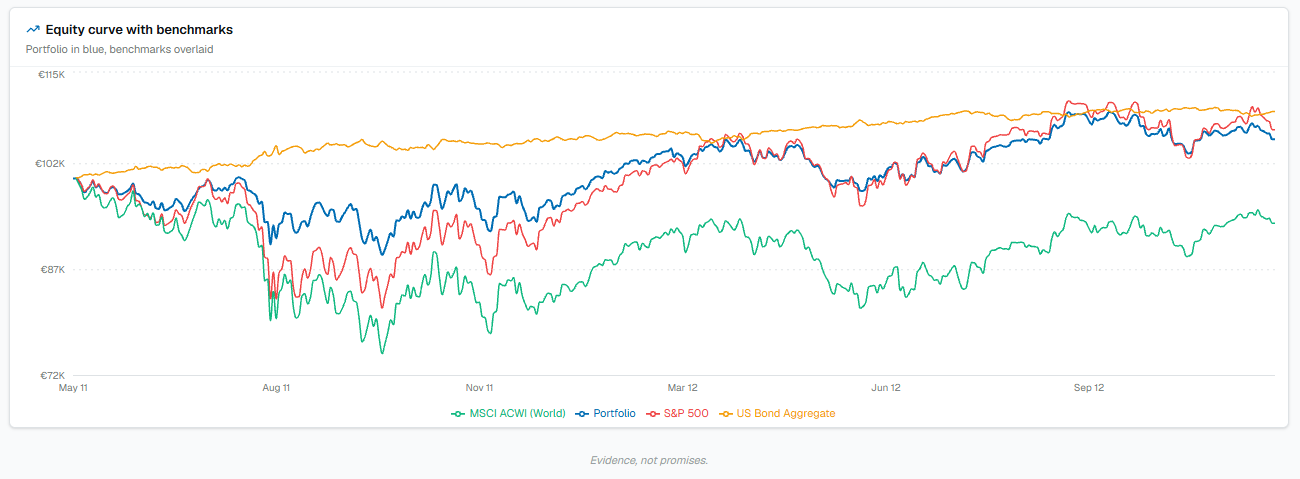
For each scenario you get a metrics table (return, CAGR, max drawdown, recovery, Sharpe, Sortino, volatility versus the benchmarks) and the equity curve with the benchmarks overlaid. Below, the four available crises, each with its table and its curve.
Covid-19 crash (2020)
European sovereign debt (2011)
2008 financial crisis (Lehman)
Dot-com bubble (2000)
To remember. The stress test shows the behavior in a specific past crisis: the next crisis will be different. It serves to verify resilience in known extreme conditions, not to predict the next one.