
Monte Carlo
The backtest shows you one story: the one that happened, with the trades in that order. But it is only one of the many that could have happened. Monte Carlo takes the trades from the backtest and replays them thousands of times in different configurations, building a range of plausible outcomes. It serves to answer: how much can I trust the result, or was it (bad) luck?
How to launch it
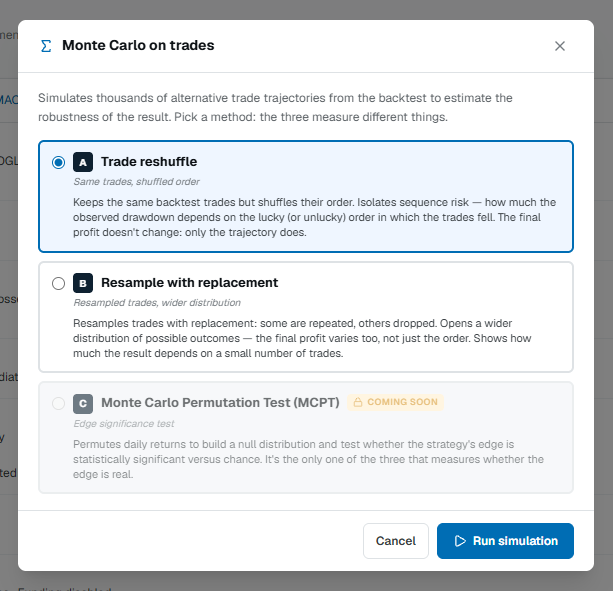
From the results page you open Monte Carlo and choose the method:
- Trade reshuffle — uses the same trades but shuffles their order. It isolates sequence risk: how much the drawdown depends on the lucky (or unlucky) order in which the trades fell. The final profit does not change, only the trajectory does.
- Resample with replacement — resamples the trades: some repeated, others excluded. It opens a wider distribution, because the final profit varies too.
- Monte Carlo Permutation Test (MCPT) — significance test of the edge (coming soon).
How to read the results
From about 1000 simulations you get, for each metric, not a single number but a range of possible values (the distribution). Instead of "the drawdown was 22%", Monte Carlo tells you the range in which it can reasonably fall.
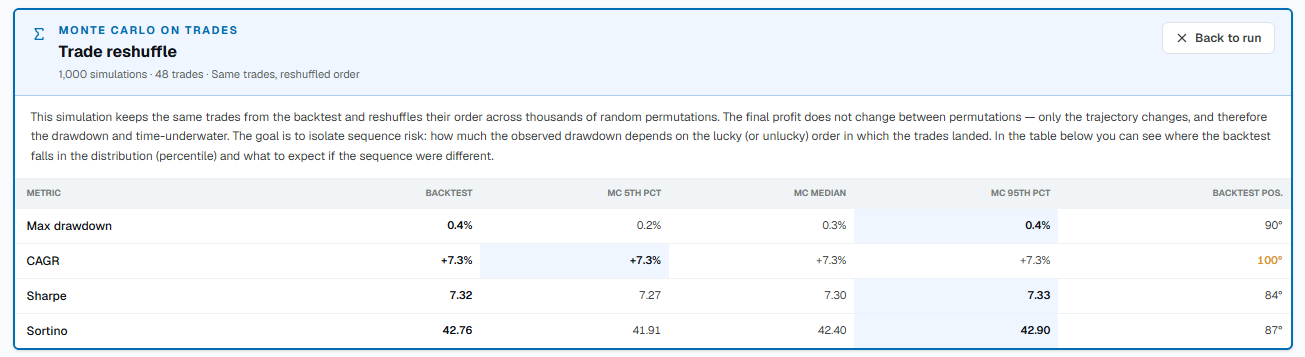
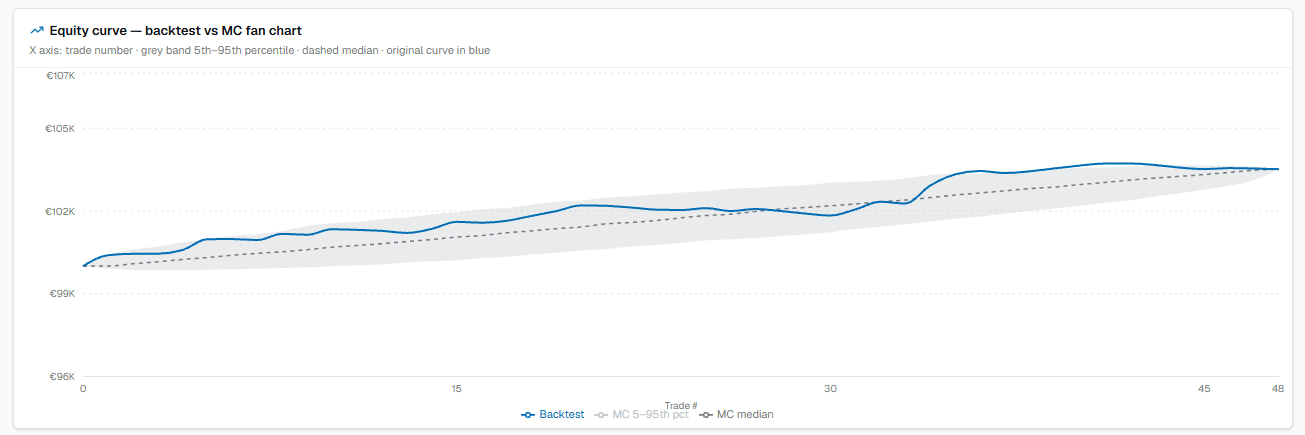
- Median (50th) — the typical outcome: half the simulations do better, half worse.
- Percentiles (5th and 95th) — the boundaries of the favorable and unfavorable scenarios. Which of the two is the "bad side" depends on the metric: for return and Sharpe it's the 5th (low values); for drawdown it's the 95th.
- Backtest position — where your actual result falls in the distribution. Near the 50th it is representative; toward the extremes it was a particular case.
- The wider the band, the more uncertain the outcome.
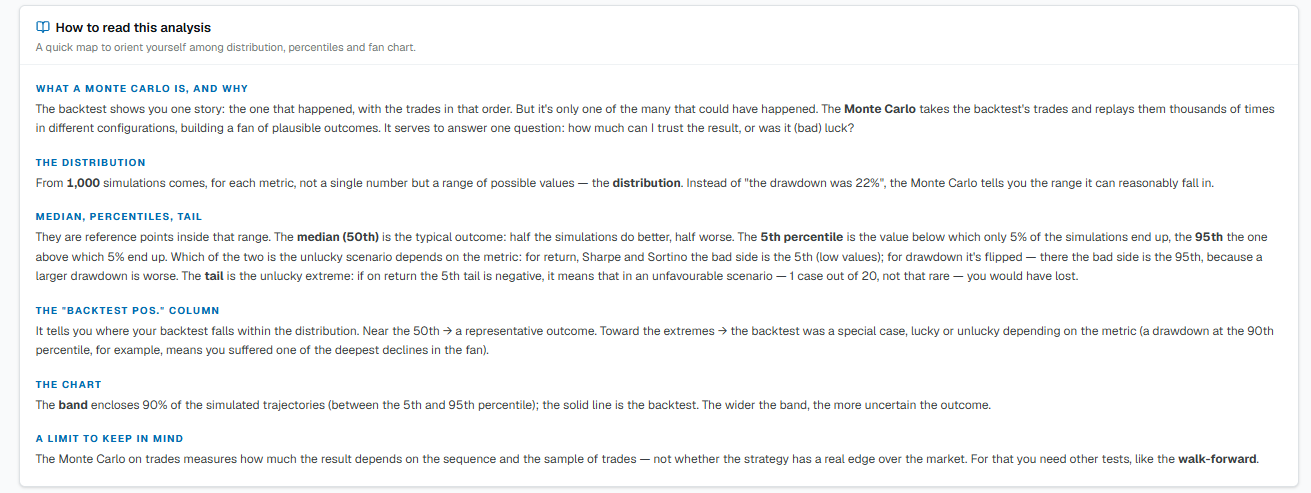
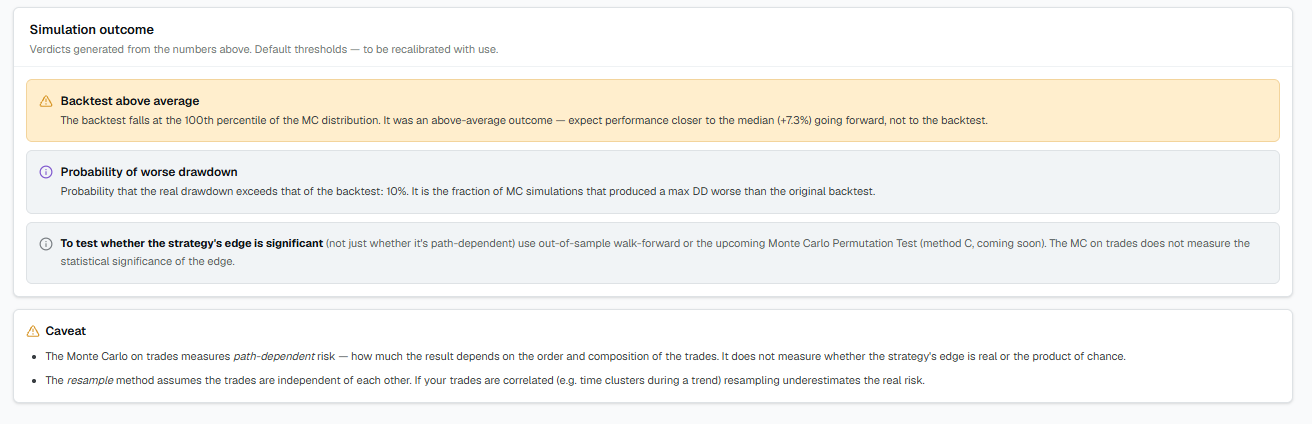
A limit to remember. Monte Carlo on trades measures how much the result depends on the sequence and the sample of trades — not whether the strategy has a real edge on the market. For that you need other tests, such as time robustness (walk-forward).