
Monte Carlo forward (portfolio)
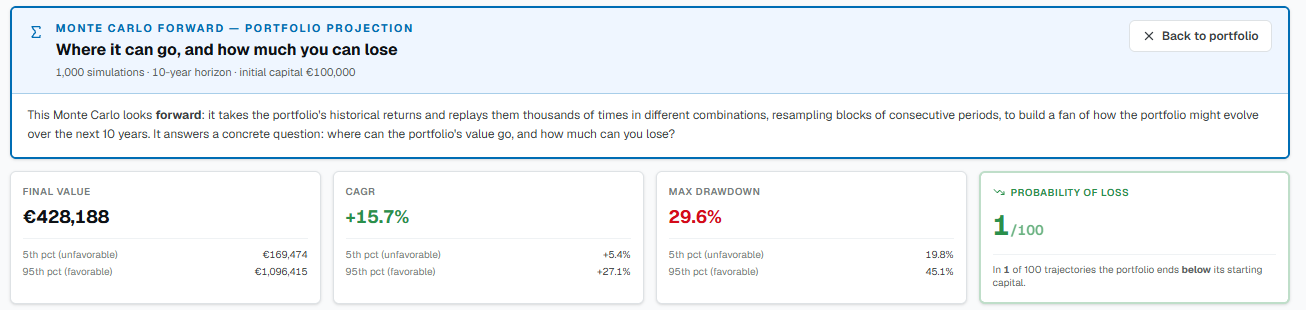
Unlike Monte Carlo on the trades of a strategy (which replays the past), this one looks forward: it takes the portfolio's historical returns and replays them thousands of times in different combinations, to build a range of how the portfolio could evolve over the next 10 years. It answers: where can it get to, and how much can I lose?
How to read it
From about 1000 trajectories you get, for each outcome (final value, return, drawdown), not a single number but a range of possible values.
- Median — the typical outcome: half the trajectories do better, half worse.
- 5th percentile — the unlucky scenario: only 1 trajectory in 20 does worse.
- Probability of loss — in how many trajectories the portfolio closes below the starting capital.
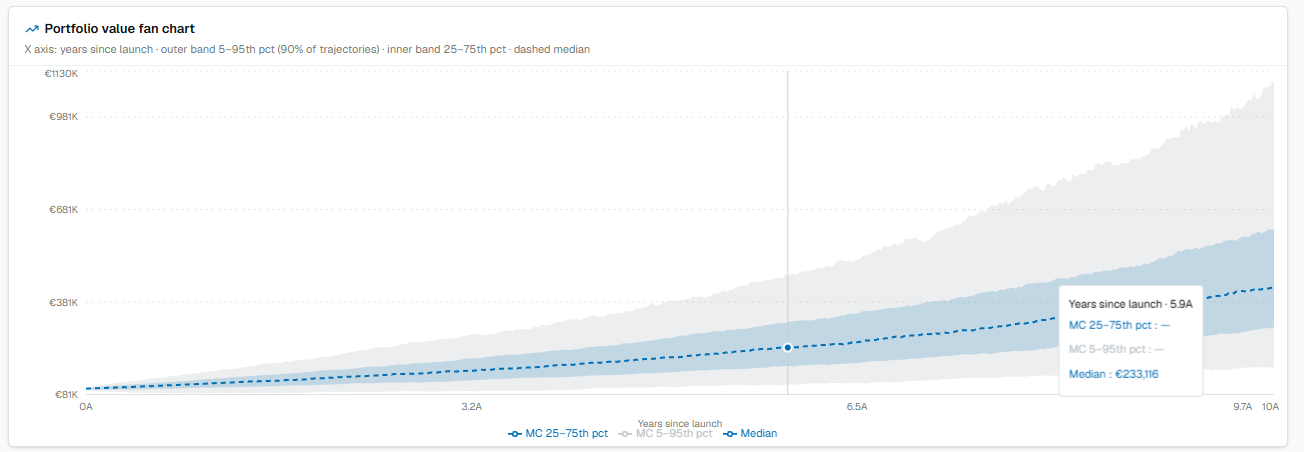
- The band encloses where most of the trajectories fall; the more it widens over time, the more the uncertainty grows.
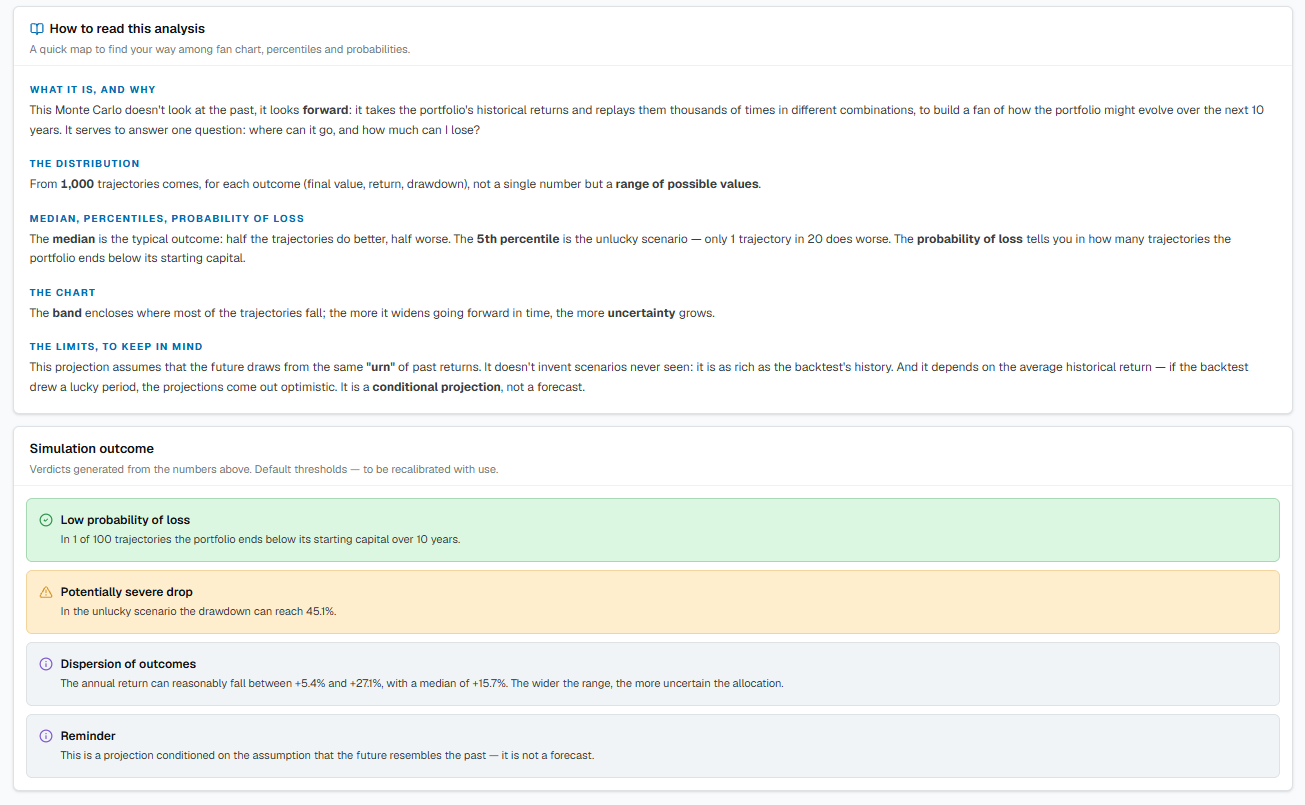
A limit to remember. This projection assumes that the future draws from the same "urn" of returns as the past. It does not invent never-seen scenarios, and it is as rich as the backtest history: if the backtest drew a lucky period, the projections come out optimistic. It is a conditional projection, not a forecast.