
How to read a backtest
When you launch the backtest of a strategy or a portfolio, Skewlab simulates how it would have behaved on historical data and returns a results page. This guide helps you read them and avoid the most common interpretation traps.
Premise. A backtest is hypothetical performance on past data: it shows how a strategy would have behaved, not how it will behave. Past results do not guarantee future ones. The goal is not "the highest number", but understanding whether a logic has a foundation and how robust it is.
The overview and the equity curve
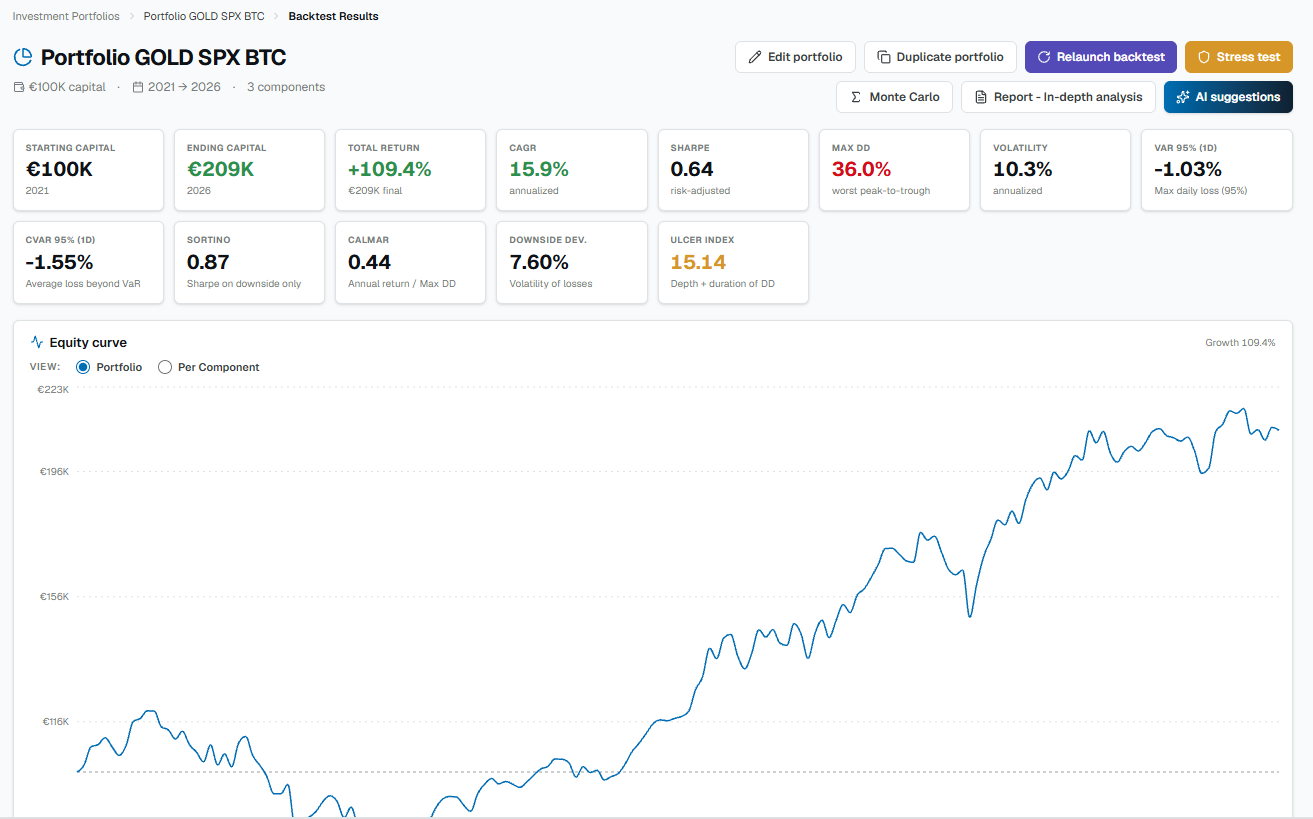
At the top you find the main metrics at a glance: capital, total and annual return (CAGR), Sharpe ratio, maximum drawdown and other measures. Always read them together: a high return with a huge drawdown is worth less than a moderate but stable return. Below them the equity curve shows how the capital would have grown over time — look beyond the end point at the shape of the path (a steady climb beats one with big swings) and the flat or declining periods.
Annual and monthly performance
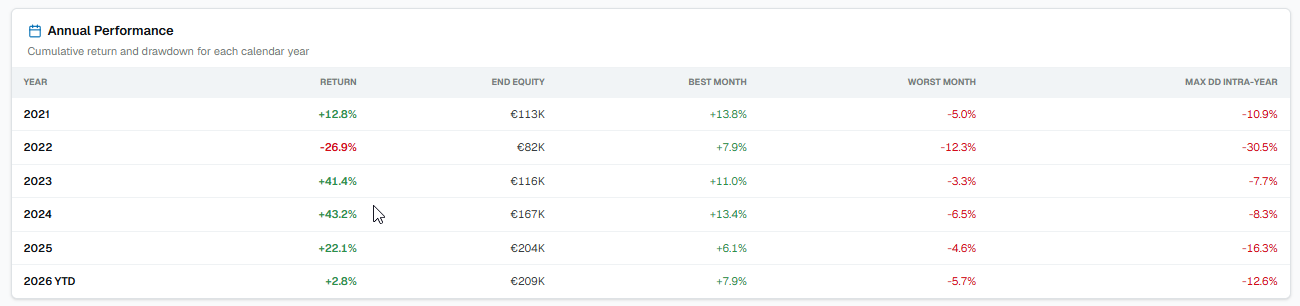
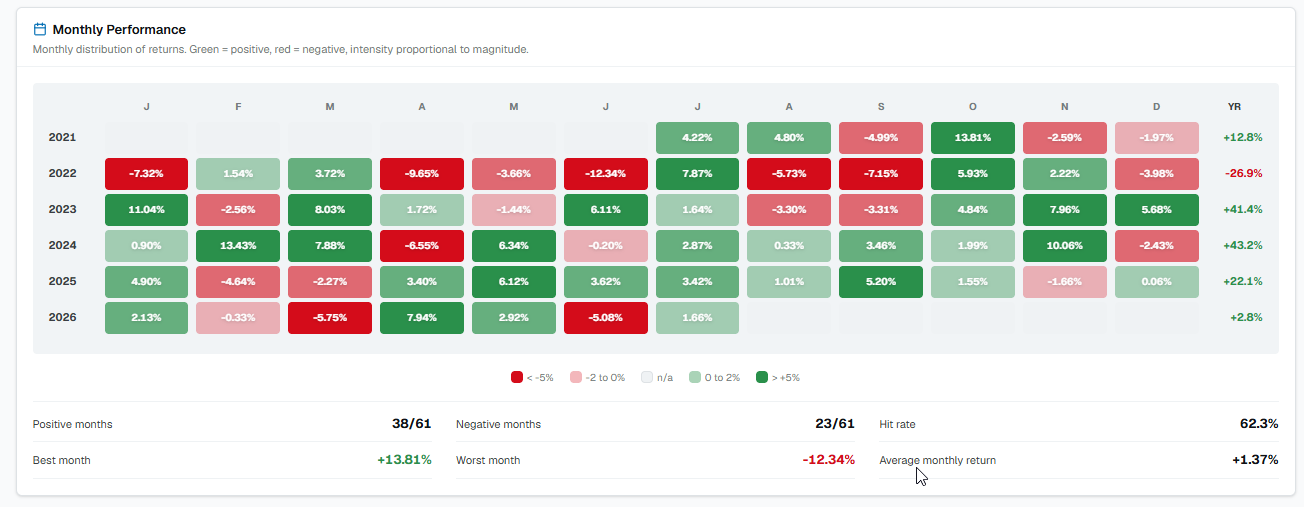
The year-by-year tables and the monthly heatmap show when the strategy gained or lost. They help you understand consistency: a strategy that returns thanks to a single exceptional year is different from one that gains steadily.
Drawdown and return distribution
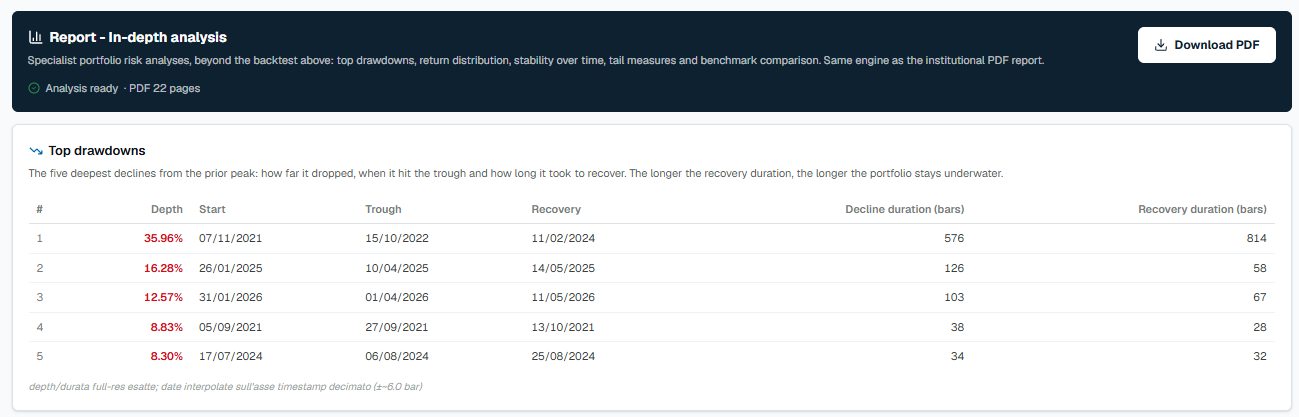
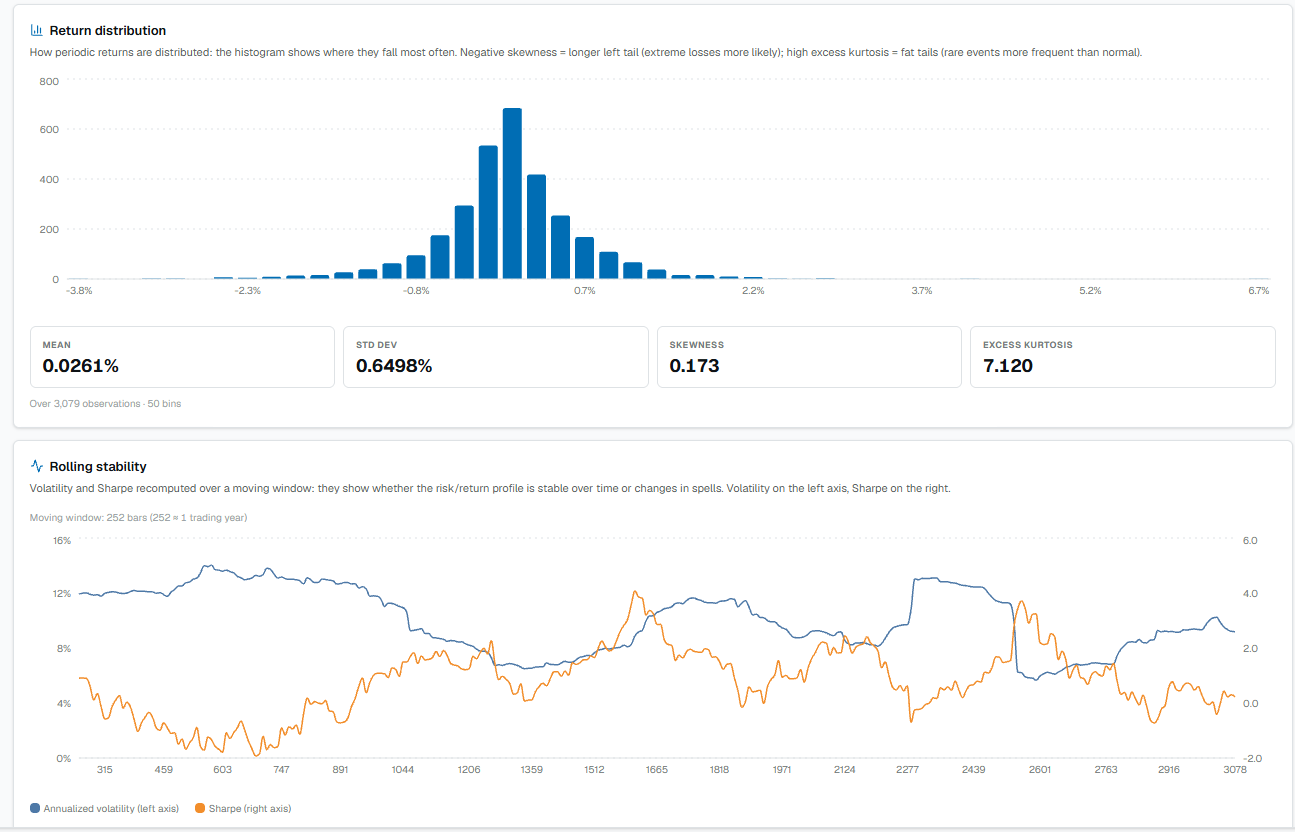
The main drawdowns list the worst losses from peak to trough, with duration and recovery. The return distribution shows the shape of the results — long left tails signal the risk of extreme losses — and the rolling stability tells you whether the risk/return profile stayed stable over time.
Tail measures and benchmark
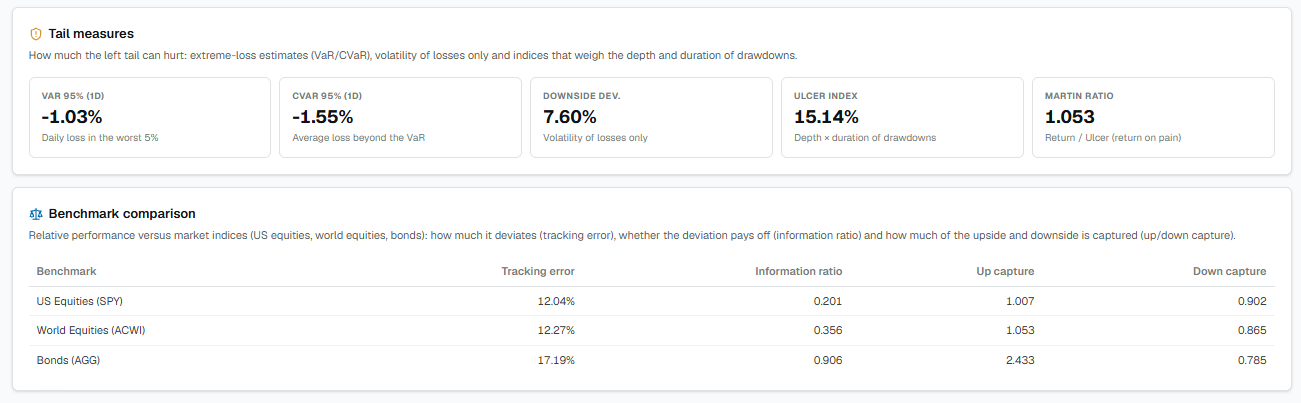
The tail measures quantify the behavior in extreme scenarios, and the comparison with a benchmark tells you whether the strategy did better or worse than a passive reference.
Portfolio composition and contribution
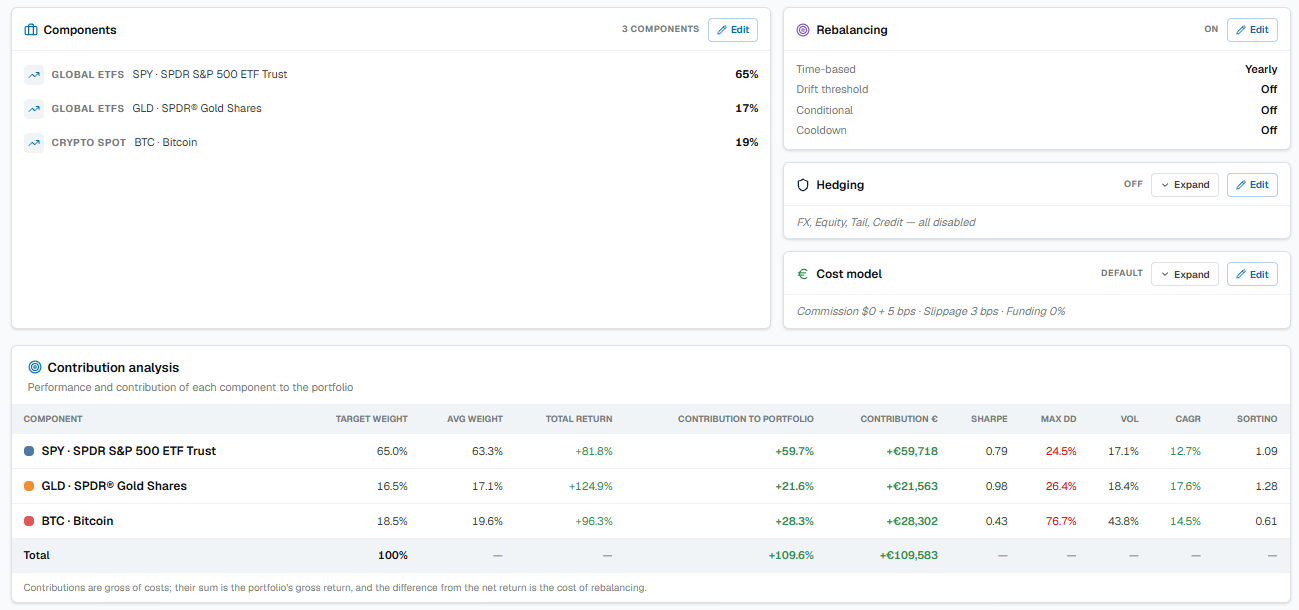
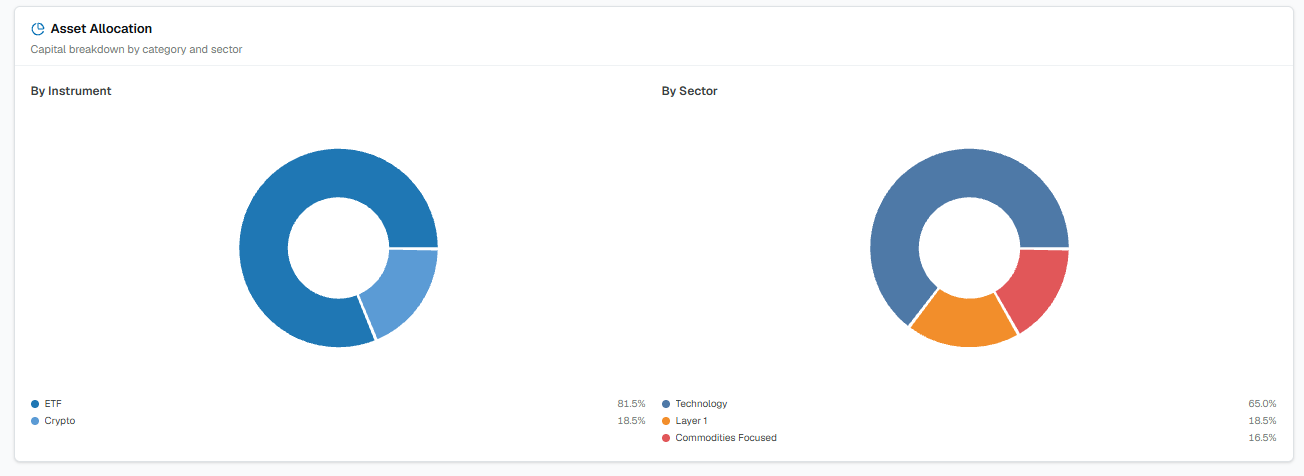
For a portfolio, the results also break down what's inside. The components panel lists each holding with its target weight, and the contribution analysis shows how much each one added to the total return, with its own risk metrics — so you can see which positions carried the portfolio and which held it back. The asset allocation view splits the capital by instrument type and by sector.
Portfolio rebalancing
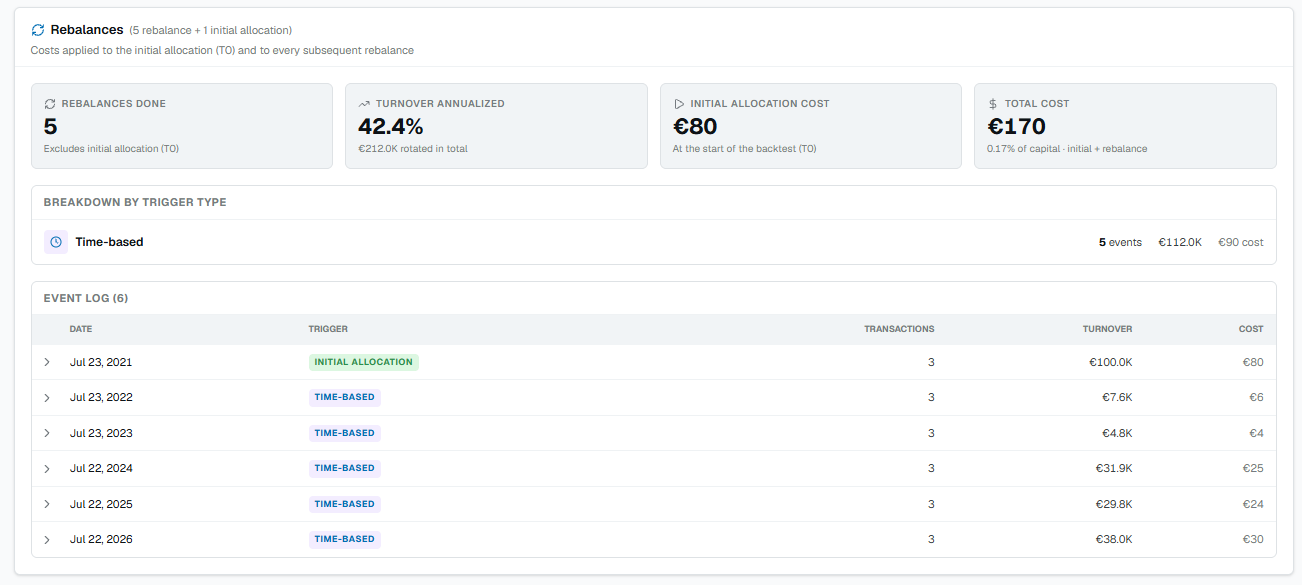
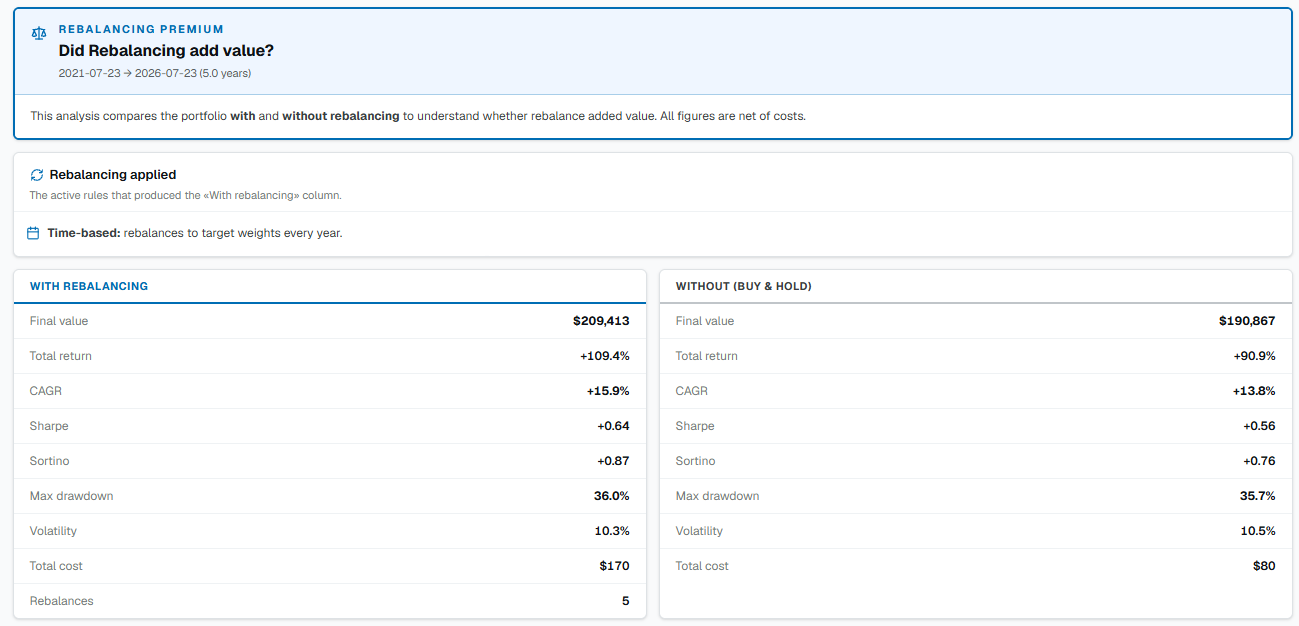
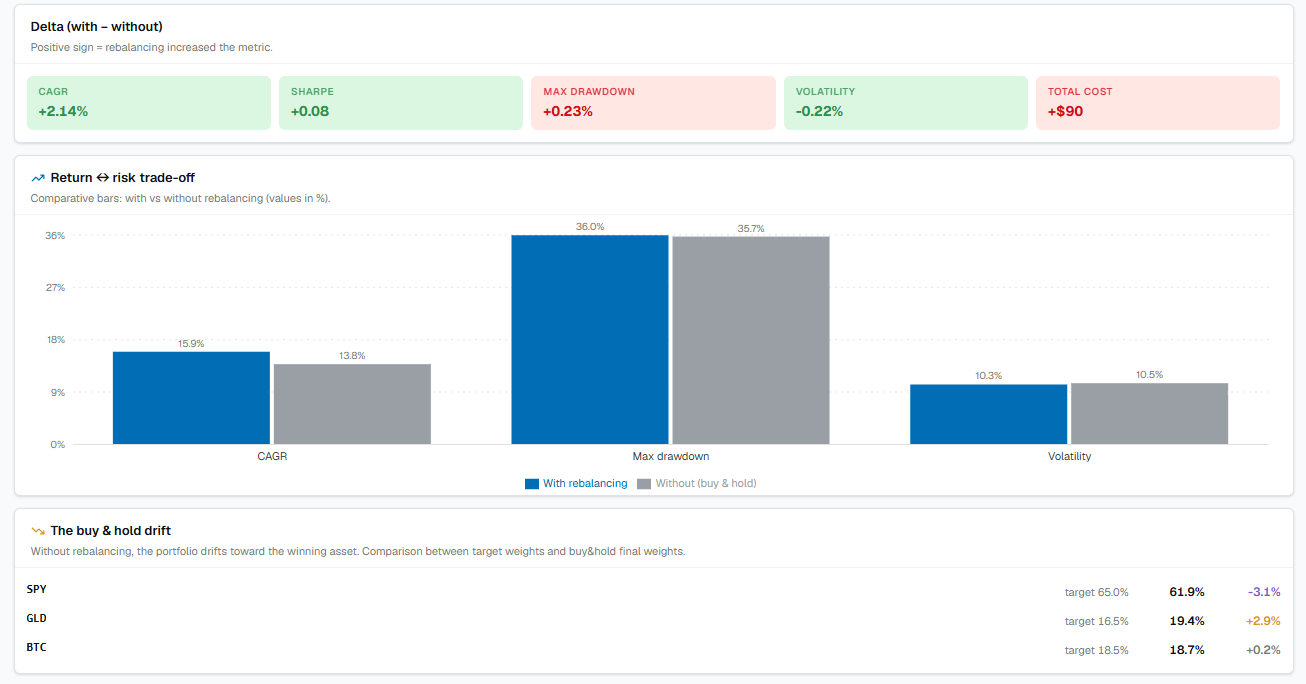
When a portfolio rebalances, the results show the rebalances performed — how many, the annualized turnover and the cost of each event. The rebalancing premium compares the portfolio with and without rebalancing to tell you whether it actually added value, all net of costs — because it isn't always worth it: it can lower risk but also cap the upside.
Warning signs
Knowing how to read a backtest means recognizing when a result is too good to be true:
- Very few trades — a spectacular return with 5-10 operations has no statistical value: it could be luck.
- Very high win rate (95-100%) — almost always signals a problem, not genius: often a stop loss is missing.
- Curve too perfect — the real market does not rise in a straight line.
- Parameter fragility — if changing a threshold slightly halves the result, the strategy is over-fitted.
The advanced analyses
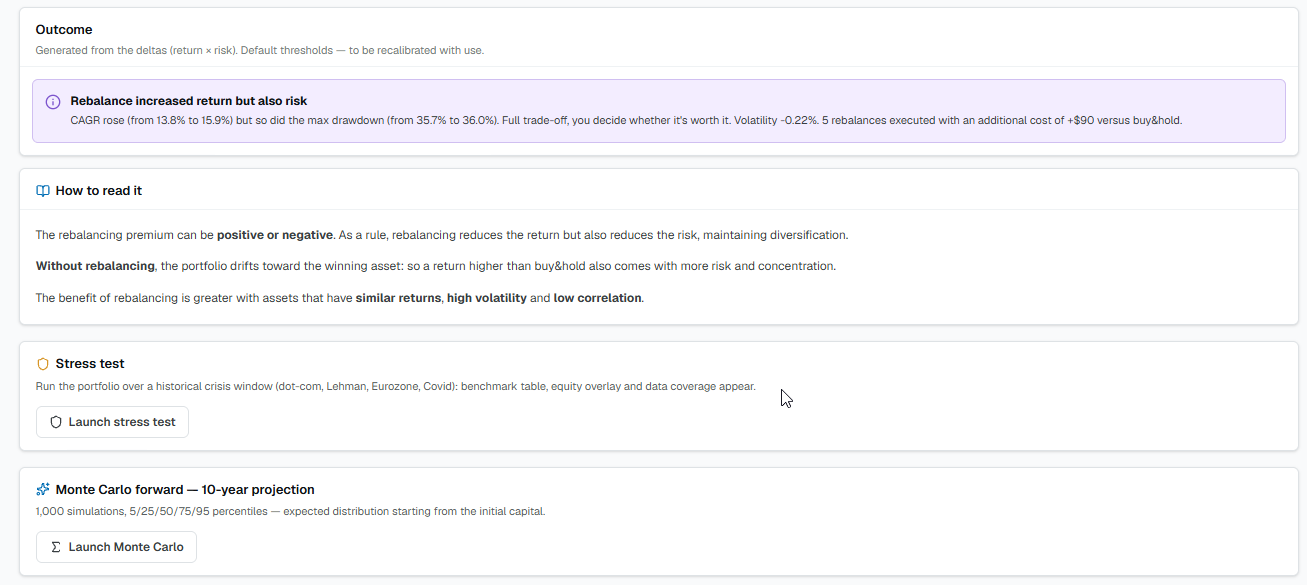
Depending on the plan you can launch analyses that test the soundness: Monte Carlo, Alpha/Beta, Time robustness, Stress test. They are the tool for distinguishing a robust strategy from a lucky one.
In summary. Don't judge a backtest by a single number. Look at return and risk together, check that there are enough trades, be wary of results that are too perfect, and use the advanced analyses to understand whether the strategy is solid or just lucky.