
Getting started with Skewlab
Welcome to Skewlab. This guide briefly explains what the platform is and how to reach your first backtest in just a few minutes.
What Skewlab is
Skewlab is a platform for testing trading strategies and portfolios on historical data (backtesting) and measuring their soundness. It answers the question: "would this idea have worked in the past, and how reliable is it?" — before you risk any capital on it.
- Strategy — a single trading logic (when to enter, when to exit, on what, with what risk). See How to create a strategy.
- Portfolio — several components combined (ETFs, strategies, bonds) with weights and rebalancing. See How to create a portfolio.
What Skewlab is not. It is an analysis and simulation tool: it does not execute real trades on the market and does not connect to your accounts to trade. Backtest results are hypothetical performance on historical data — they are meant to study and validate ideas, not a promise of future returns.
The dashboard
This is your starting point: the greeting, some overview metrics, your recent strategies and portfolios, and your most recent activity with quick access.
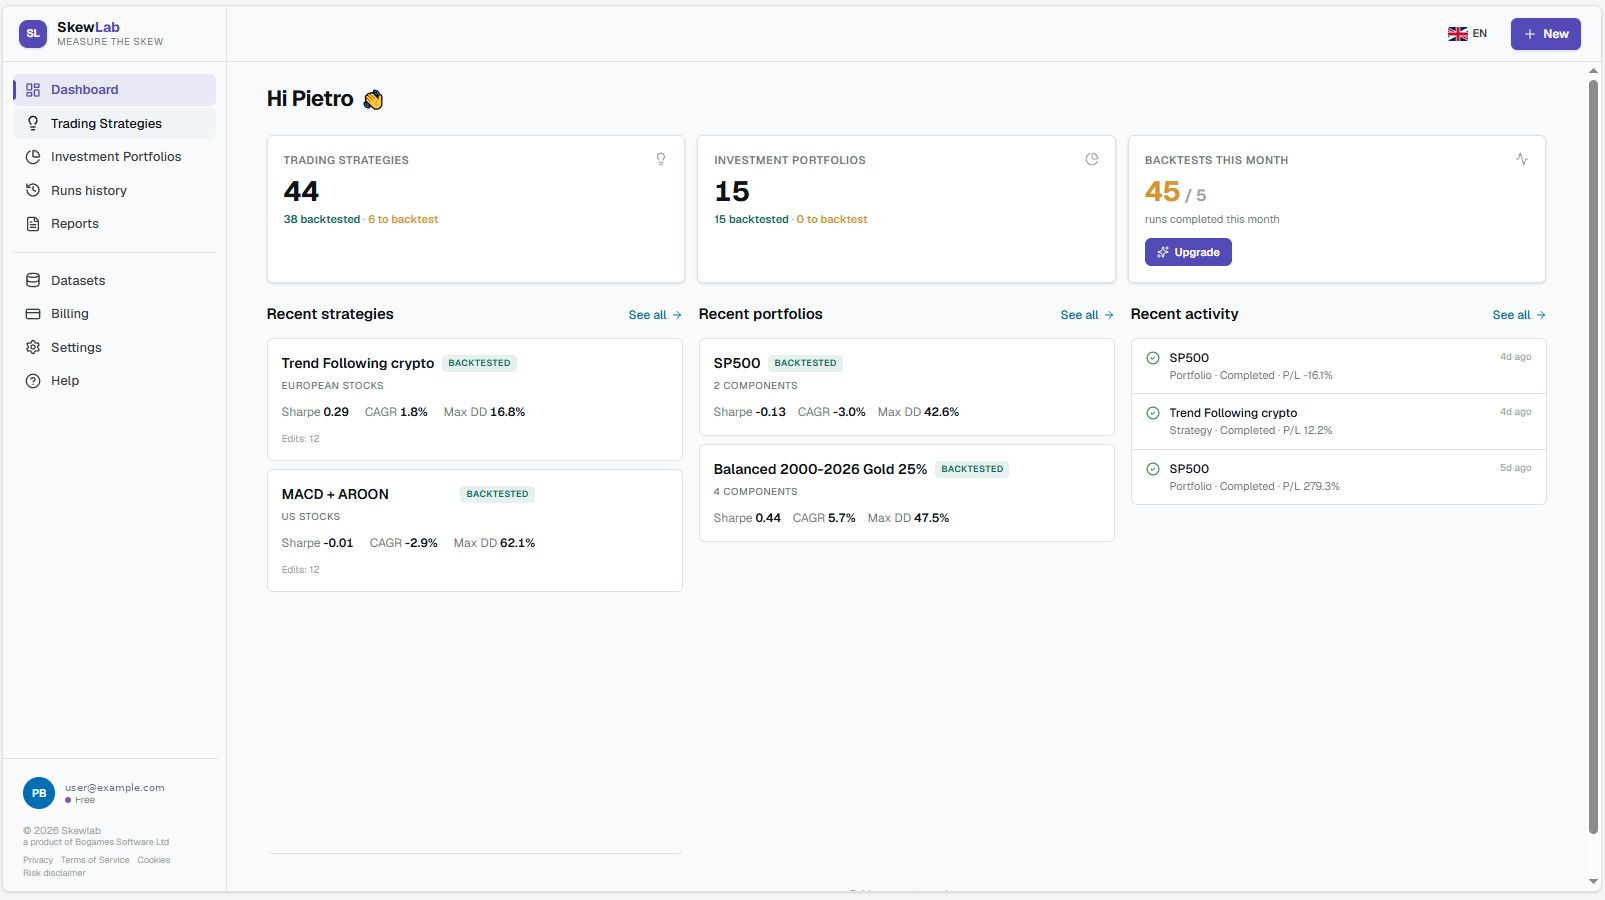
How to get around
From the sidebar you reach all the sections: Dashboard (overview), Trading Strategies (strategy library), Investment Portfolios (portfolio library), Runs history (backtest history), Reports, Datasets (market data), Billing (plan and subscription), Settings (profile and preferences).
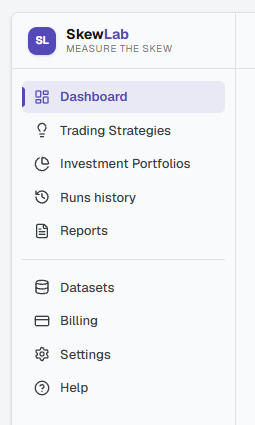
The main sections
Trading Strategies and Investment Portfolios are your two libraries: here you create, find and relaunch strategies and portfolios.
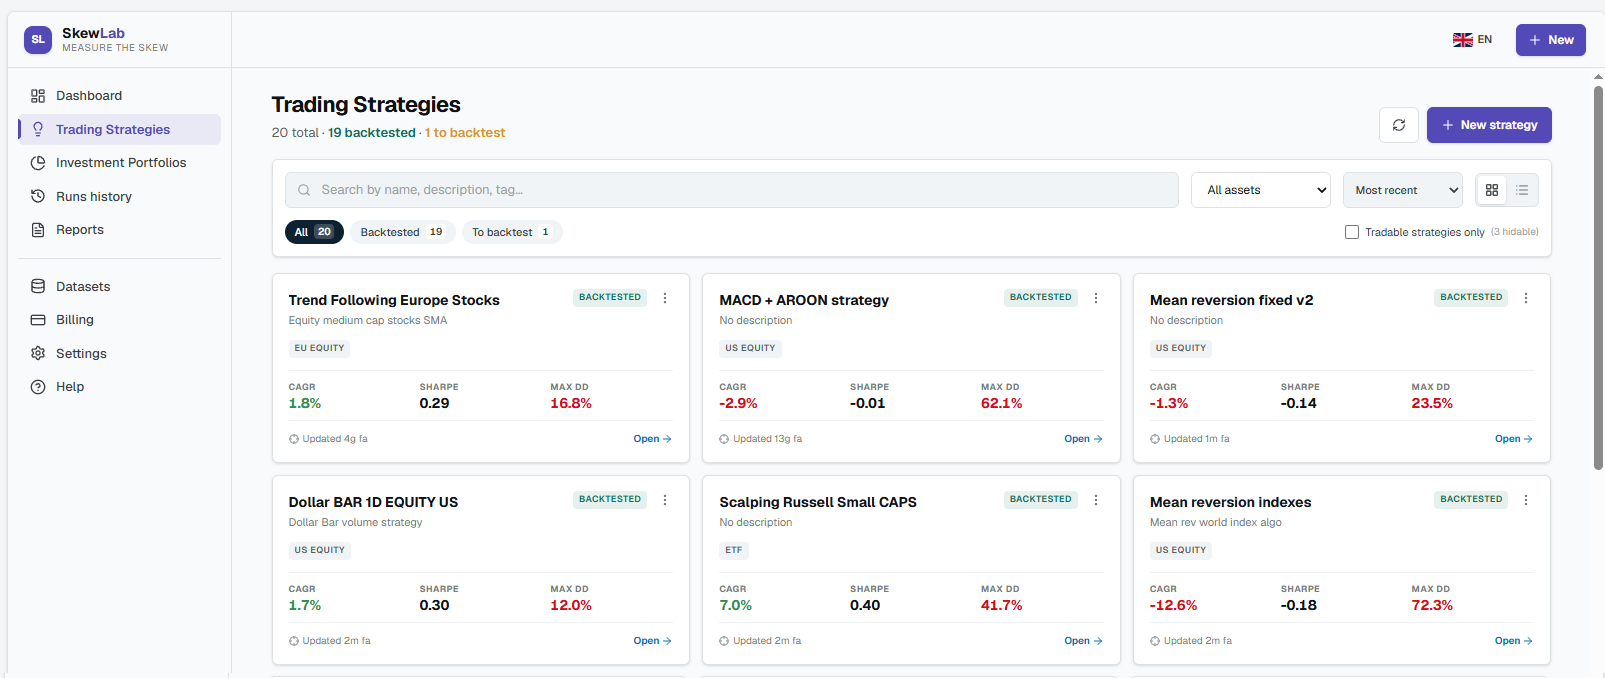
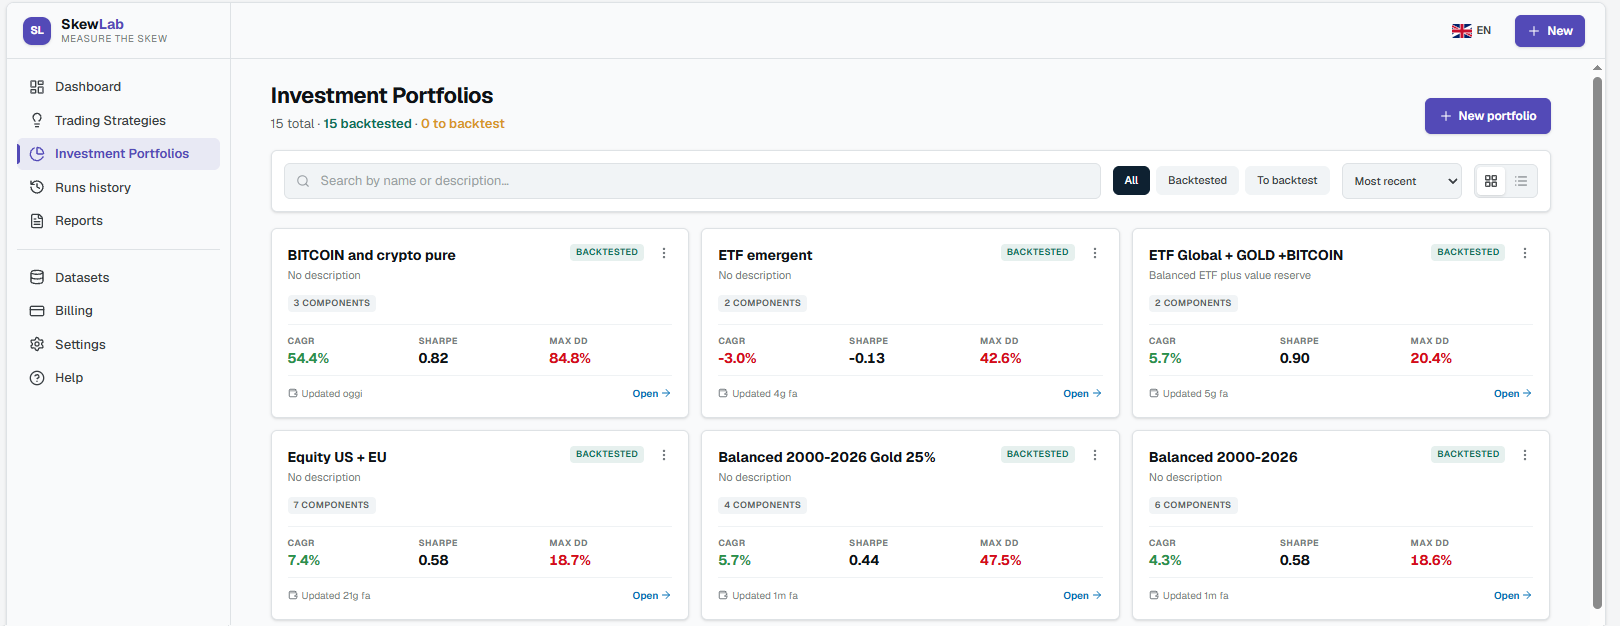
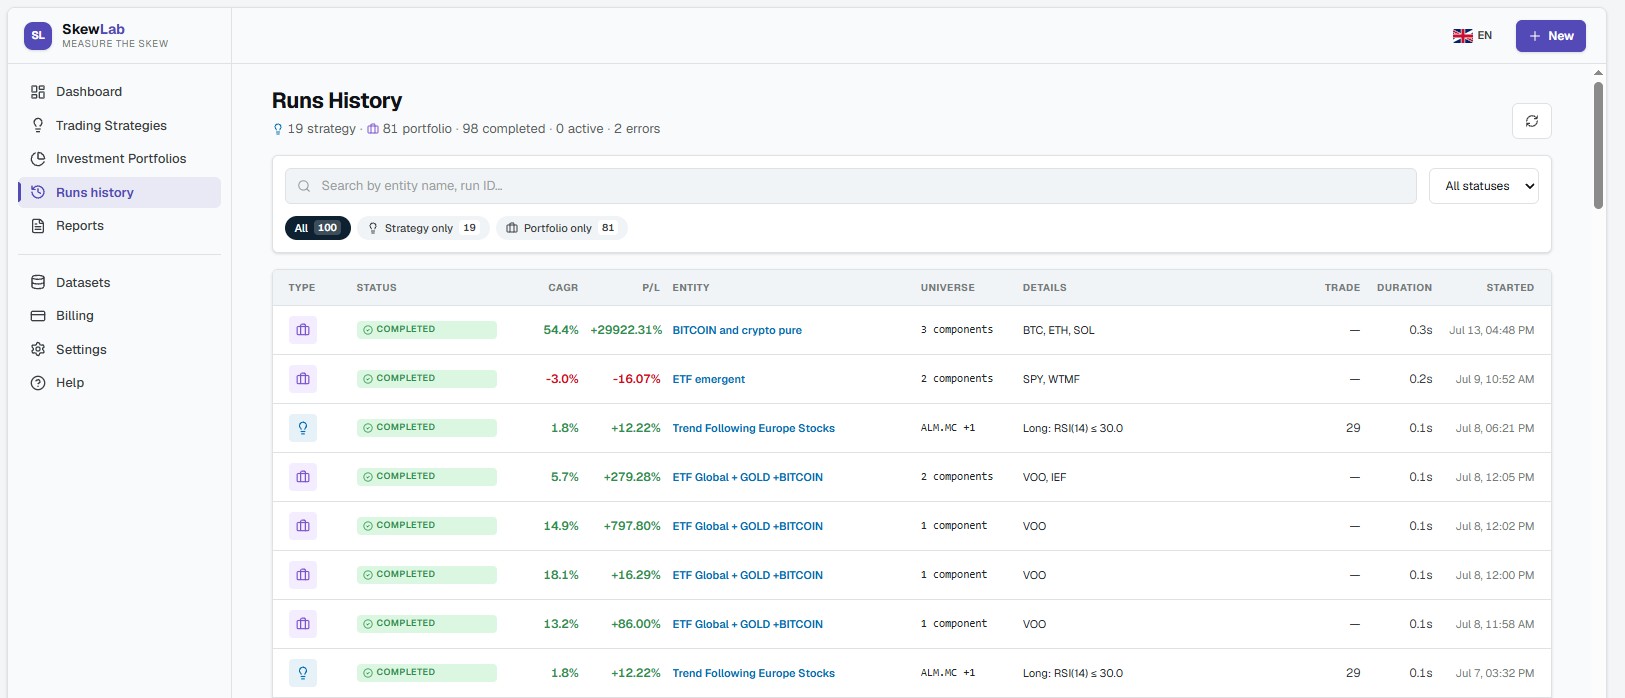
Runs history collects all the backtests you have launched, with their outcome; from here you open the detail of each one.
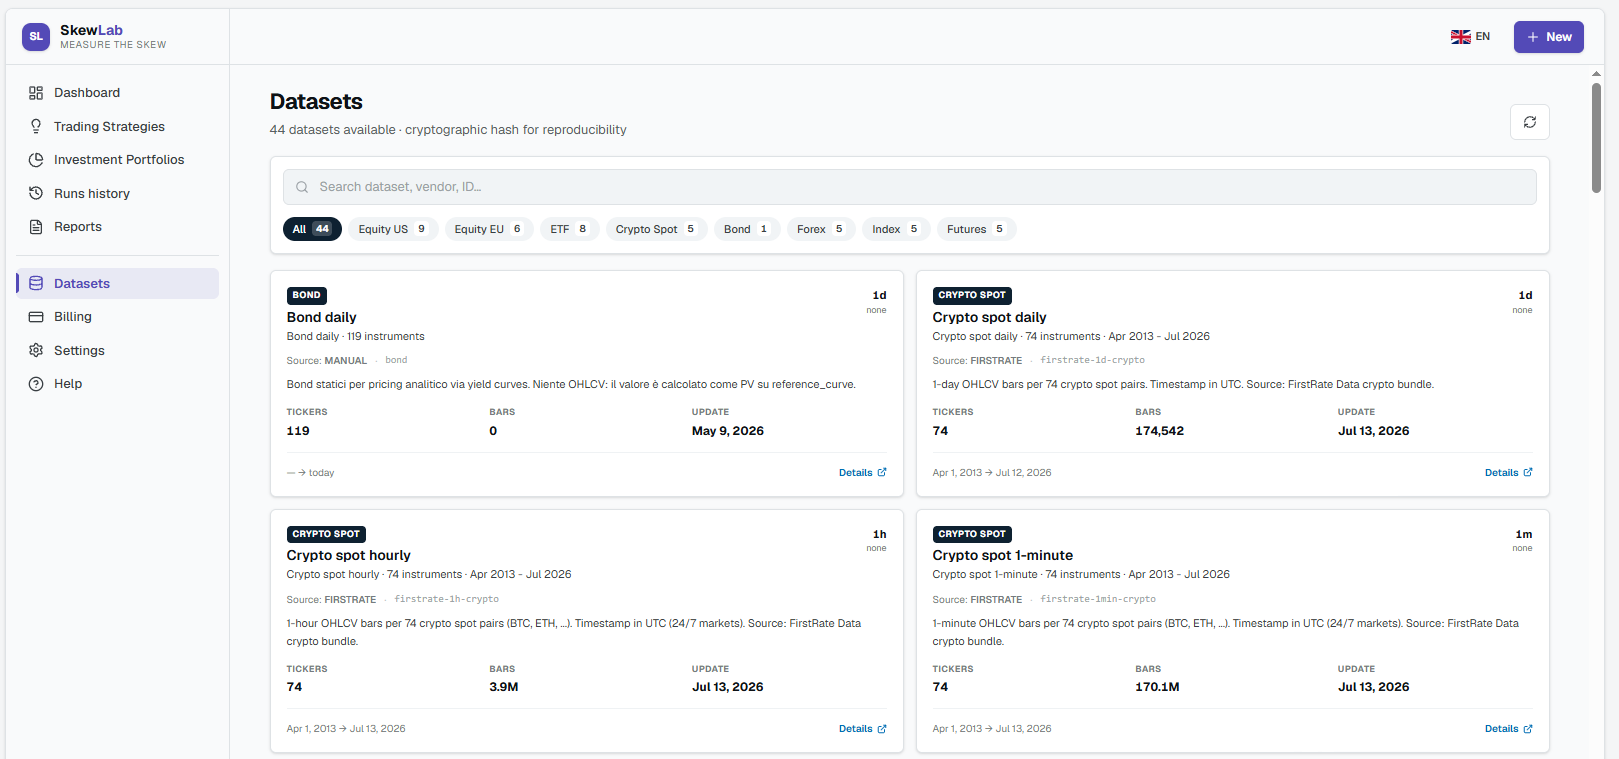
Datasets shows the market data you can work with.
Your first backtest in 5 minutes
- Create a strategy from Trading Strategies. The wizard guides you through 8 steps.
- Choose a simple universe — an asset class you know (e.g. US Stocks) and a few instruments.
- Set one entry rule and one exit rule — even just a single simple condition is enough to start.
- Launch the backtest — at the last step choose Save and launch backtest.
- Read the results — equity curve and metrics. The guide How to read a backtest helps you interpret them.
Data and plans
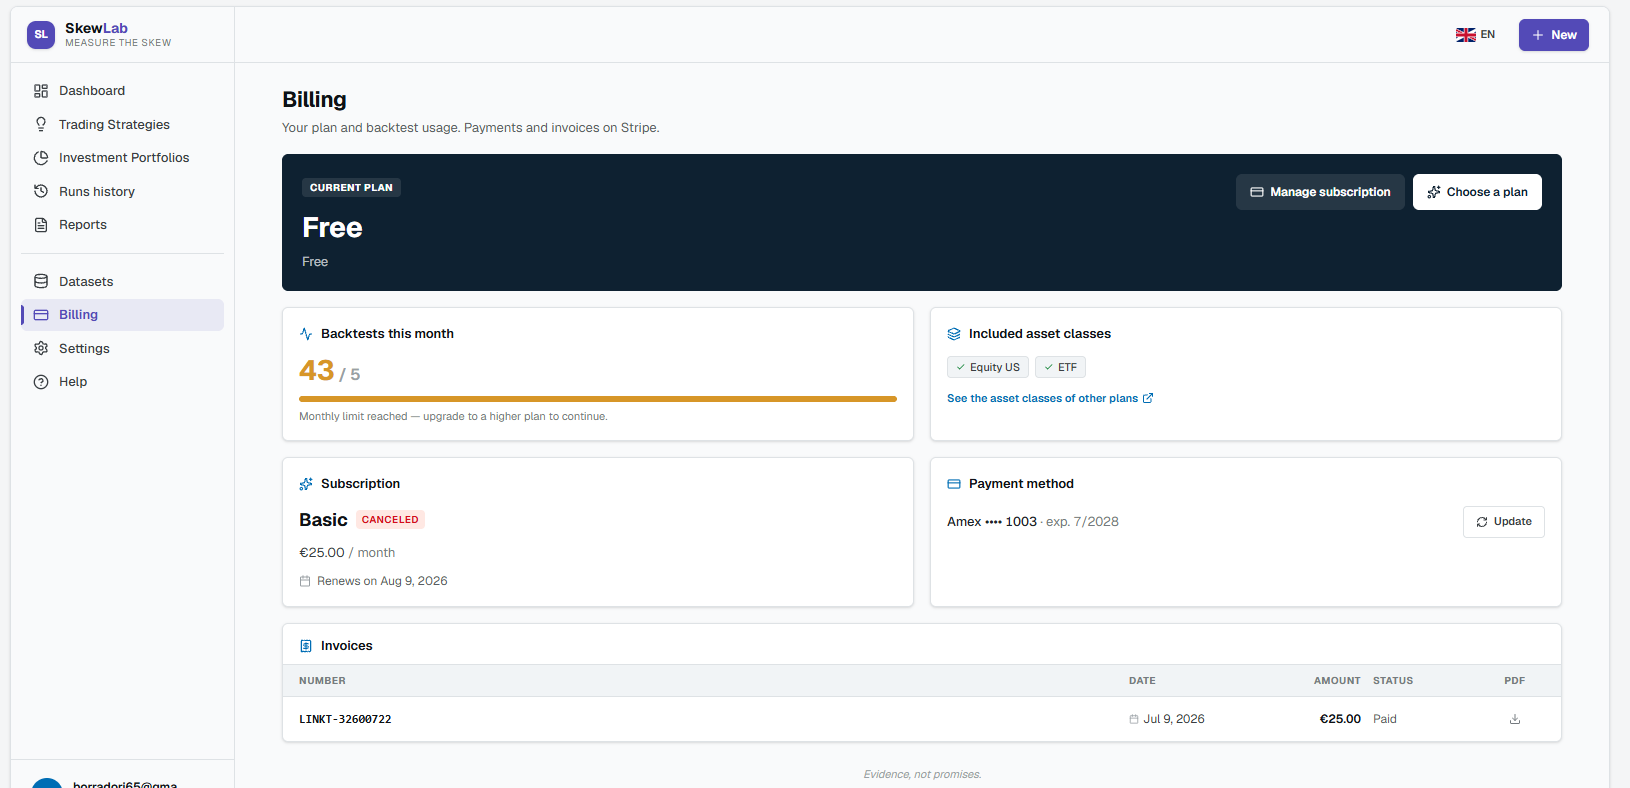
Skewlab uses professional-grade market data, with care for the correctness of backtests: for US stocks, for example, it also includes companies that went bankrupt or were delisted during the tested period (no survivorship bias, the error of testing only on surviving companies). In the Billing section you find your current plan and can upgrade to a higher one.
Need help?
If something is unclear or you run into a problem, write to us at support@skewlab.io.