
How to create a strategy
A strategy in Skewlab is a set of rules that define when to enter and when to exit the market, on which instruments and with what risk management. The wizard guides you through 8 steps: at the end you can save it as a draft or launch the backtest right away.
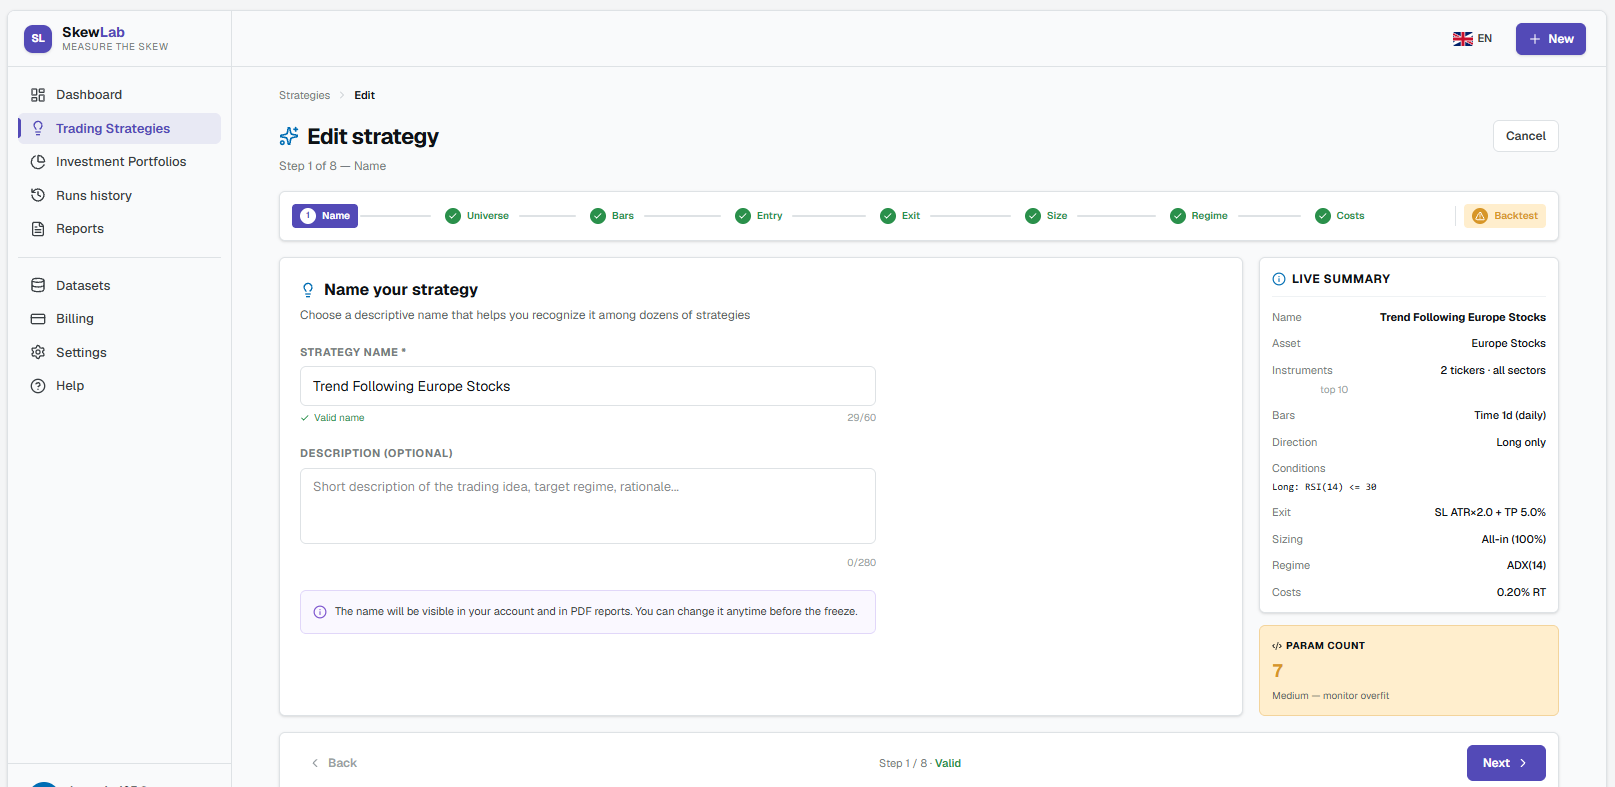
Step 1 — Name
Give the strategy a name and, if you like, a short description. They help you find it in your library: choose something recognizable, especially if you plan to create many versions.
Step 2 — Universe
Here you choose what the strategy operates on: first the asset class (US Stocks, Global ETFs, Crypto, Forex, Indices, Futures, European Stocks), then the specific instruments — in manual mode (you type the tickers) or automatic mode (screening filters).
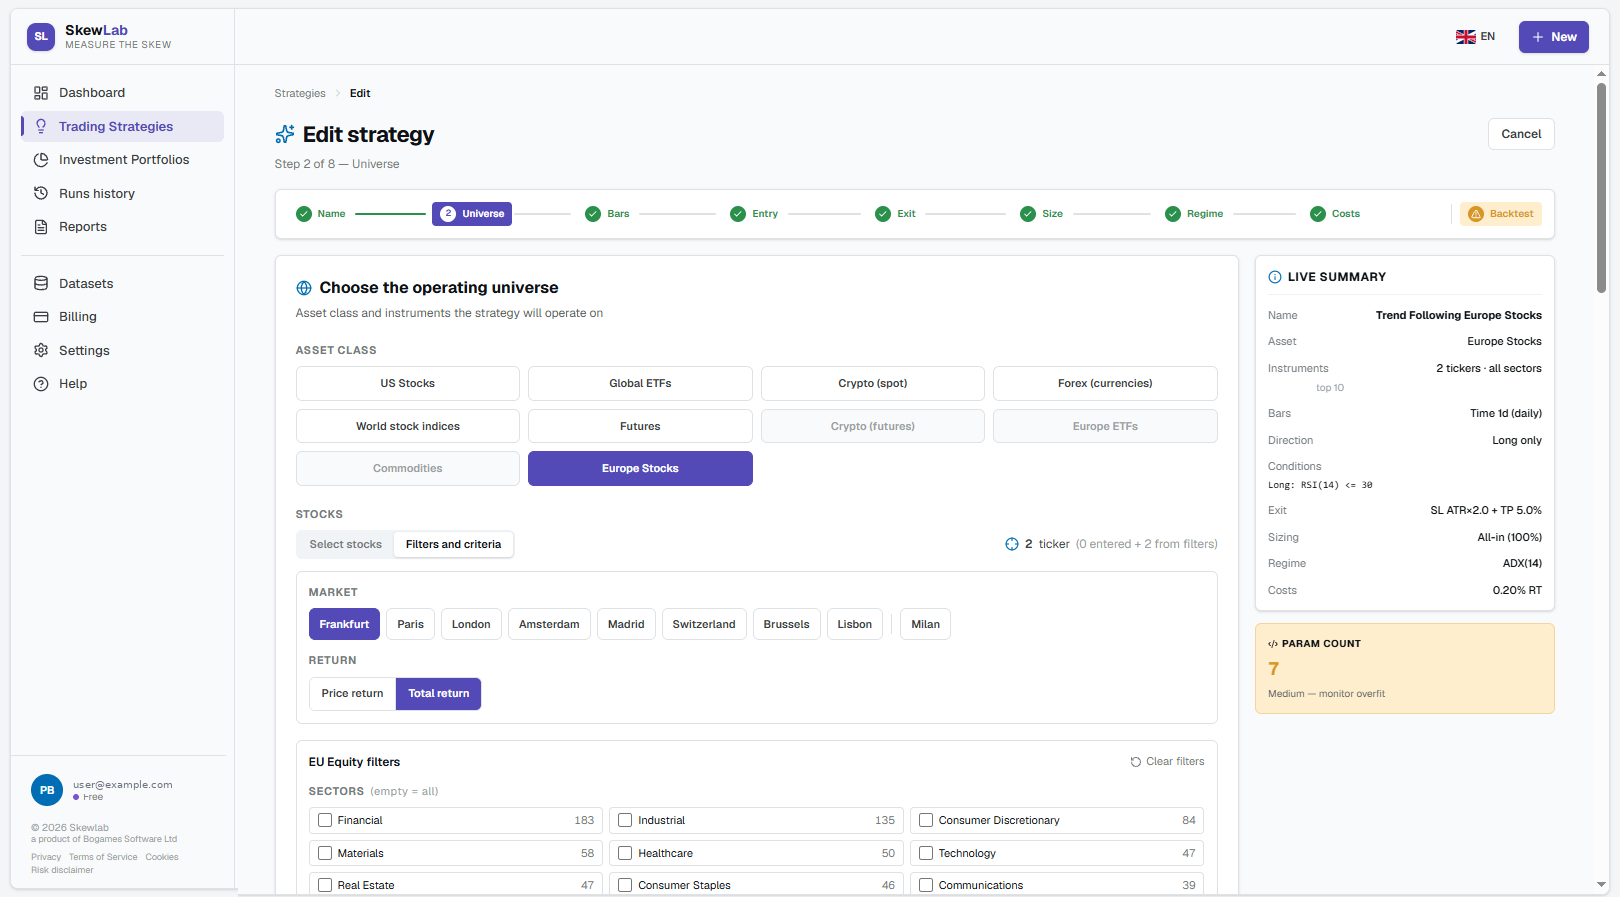
Data quality. For US stocks the universe also includes companies that went bankrupt or were delisted during the tested period. This makes backtests more realistic: the strategy is put to the test on the "losers" too, not just on surviving companies (no survivorship bias).
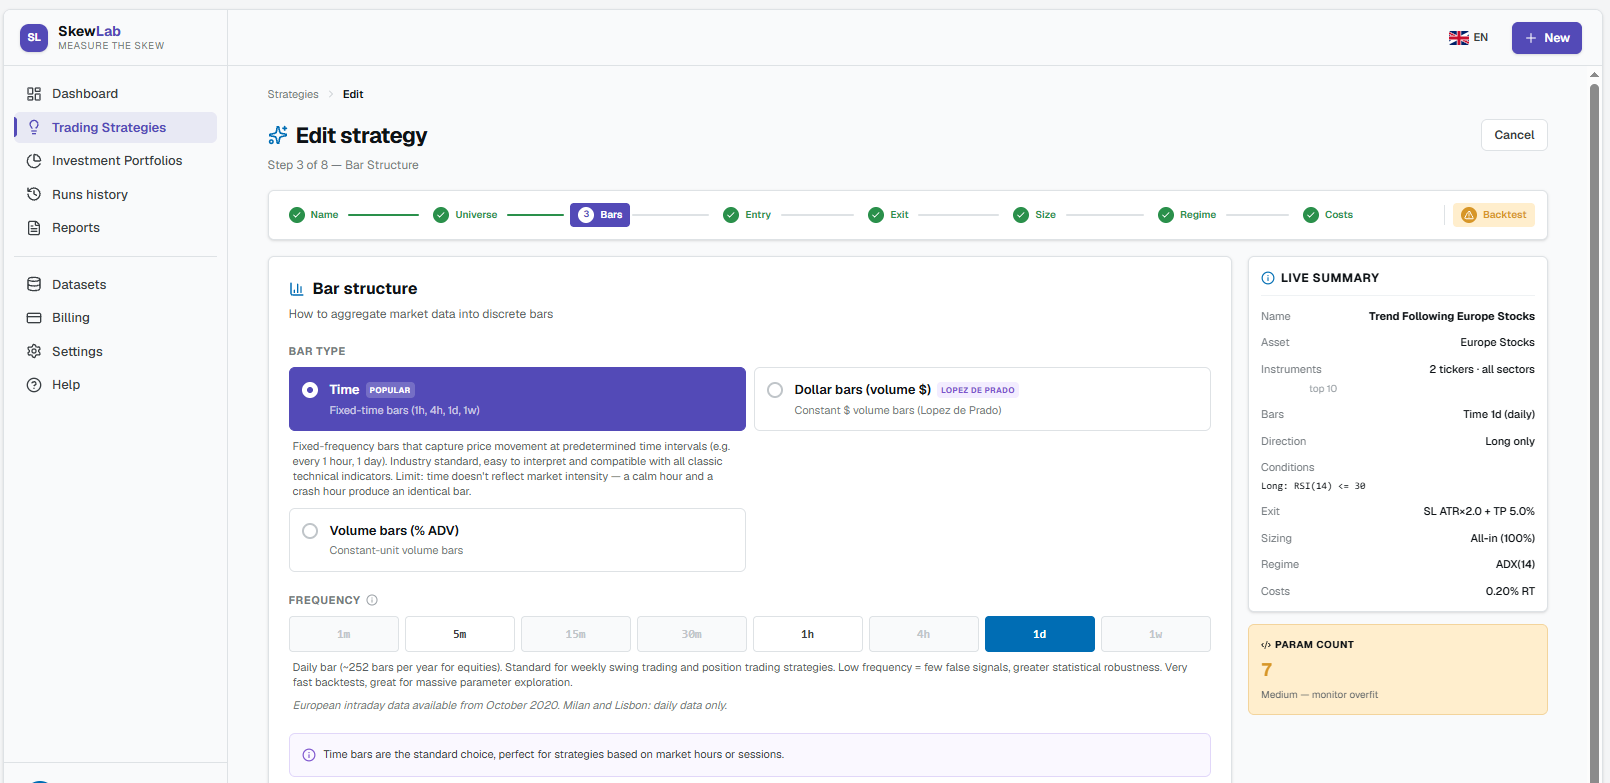
Step 3 — Bar structure
Define how price data is aggregated: time bars (1h, 4h, 1d, 1w), dollar bars, volume bars or range bars. Availability depends on the chosen asset class.
Step 4 — Entry conditions
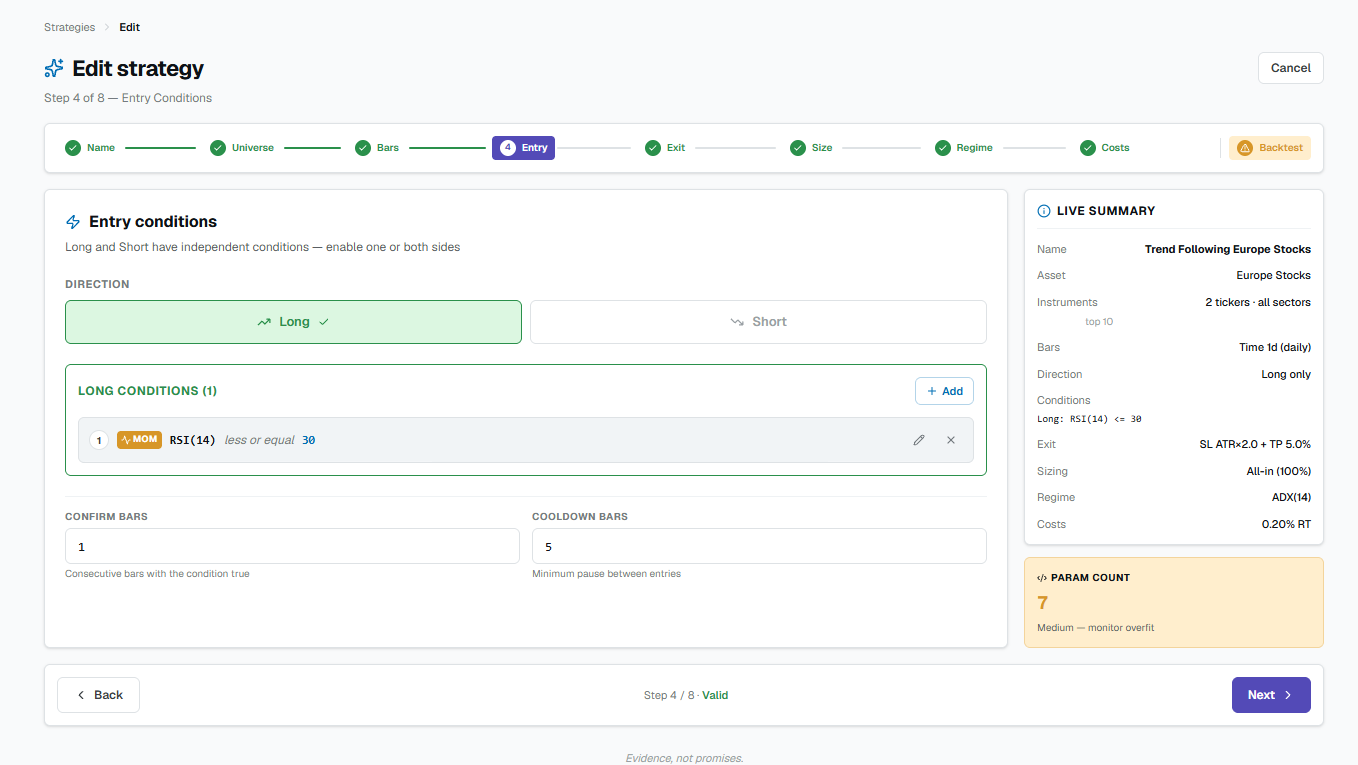
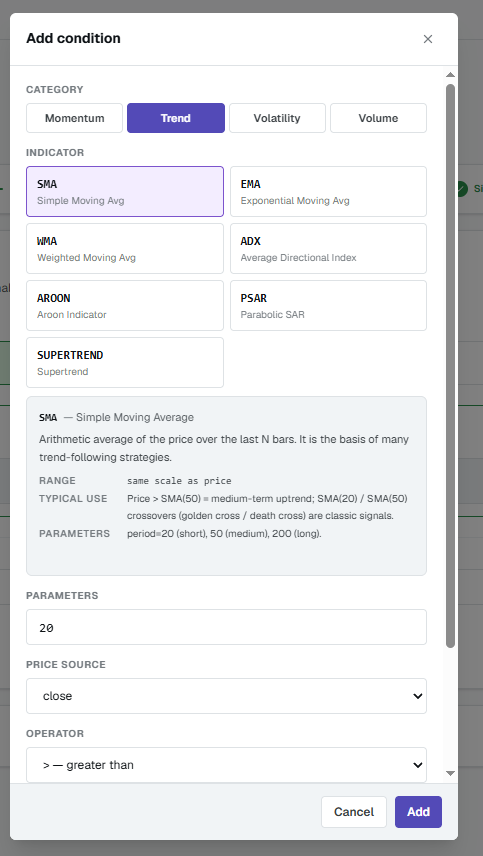
Define when the strategy opens a position, with independent conditions for Long and Short. Each condition is: an indicator + a comparator + a value or reference (e.g. RSI less than 30). Available indicators by family: Momentum, Trend, Volatility, Volume. Multiple conditions are combined with AND / OR.
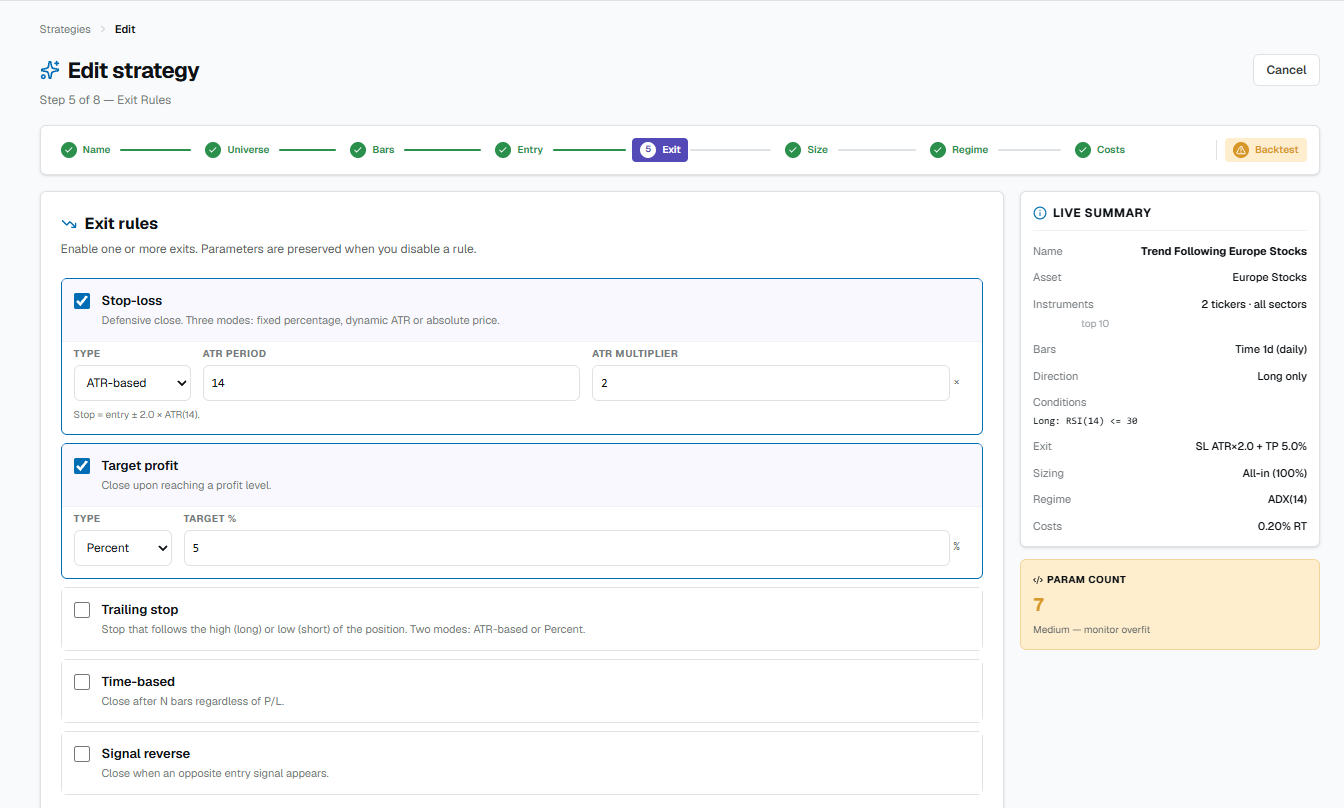
Step 5 — Exit rules
Define how the strategy closes positions: Stop loss, Take profit, Trailing stop, Time stop, Opposite signal. You can enable more than one, for Long and Short.
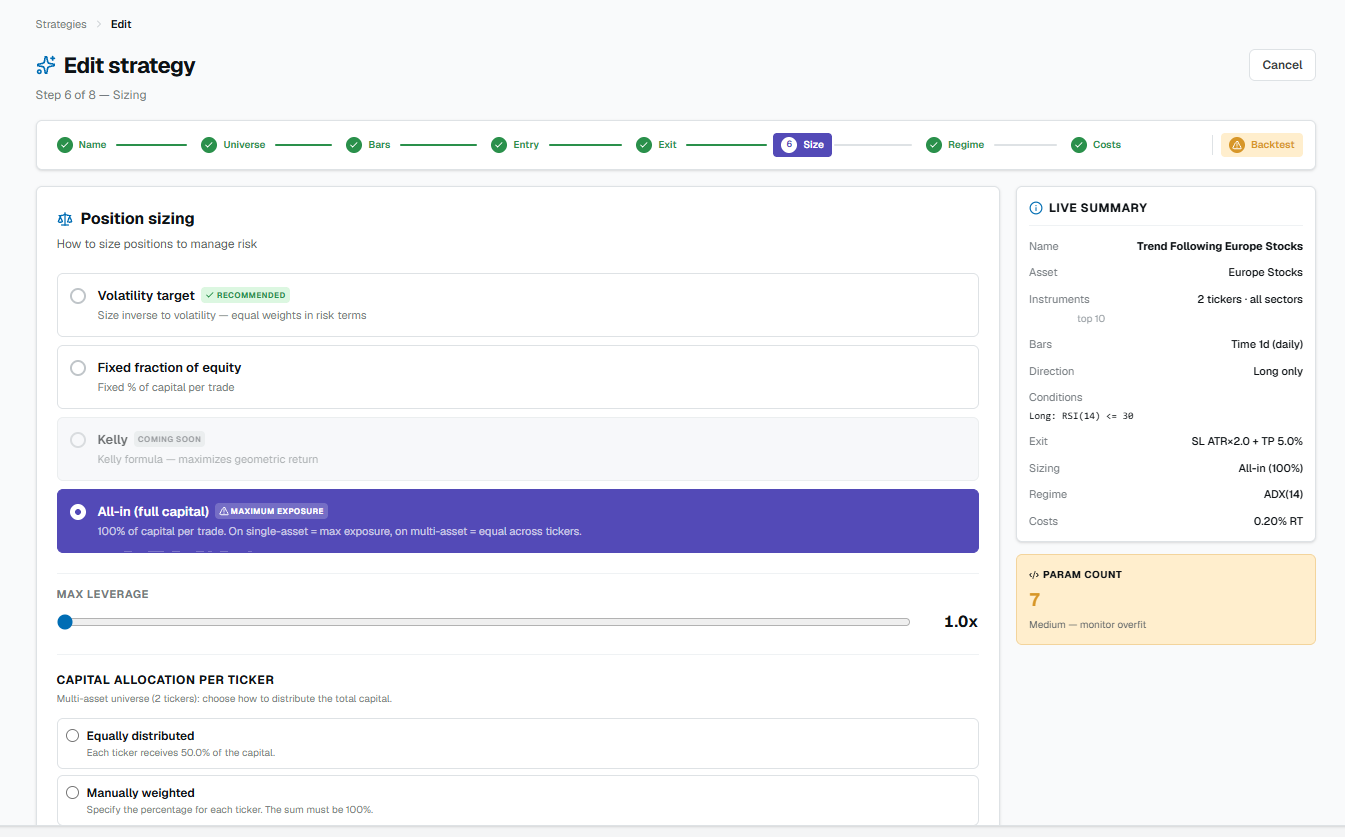
Step 6 — Sizing
Set how much capital to commit per position: Volatility target (recommended), Fixed fraction of equity, Kelly or All-in. Plus the maximum leverage.
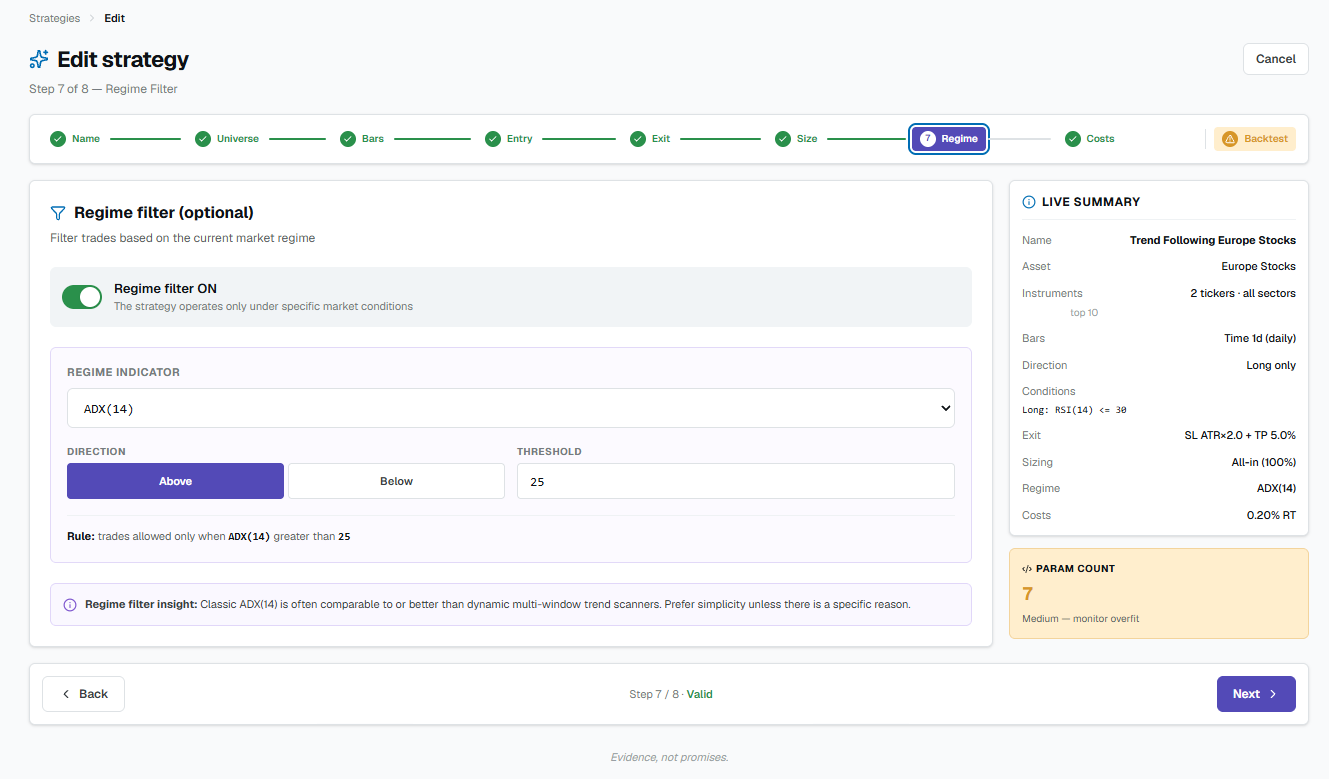
Step 7 — Regime filter
An optional step: it lets the strategy operate only when the market is in a certain condition (e.g. strong trend), pausing it otherwise. Choose a regime indicator — ADX(14), ATR(14), Bollinger width(20), realized volatility(30), multiple trend score — and a threshold. If you don't need it, skip it.
Step 8 — Costs and summary
You set the transaction costs (commissions in bps, slippage, funding) — essential for a realistic backtest — and review the final summary of the whole strategy before proceeding.
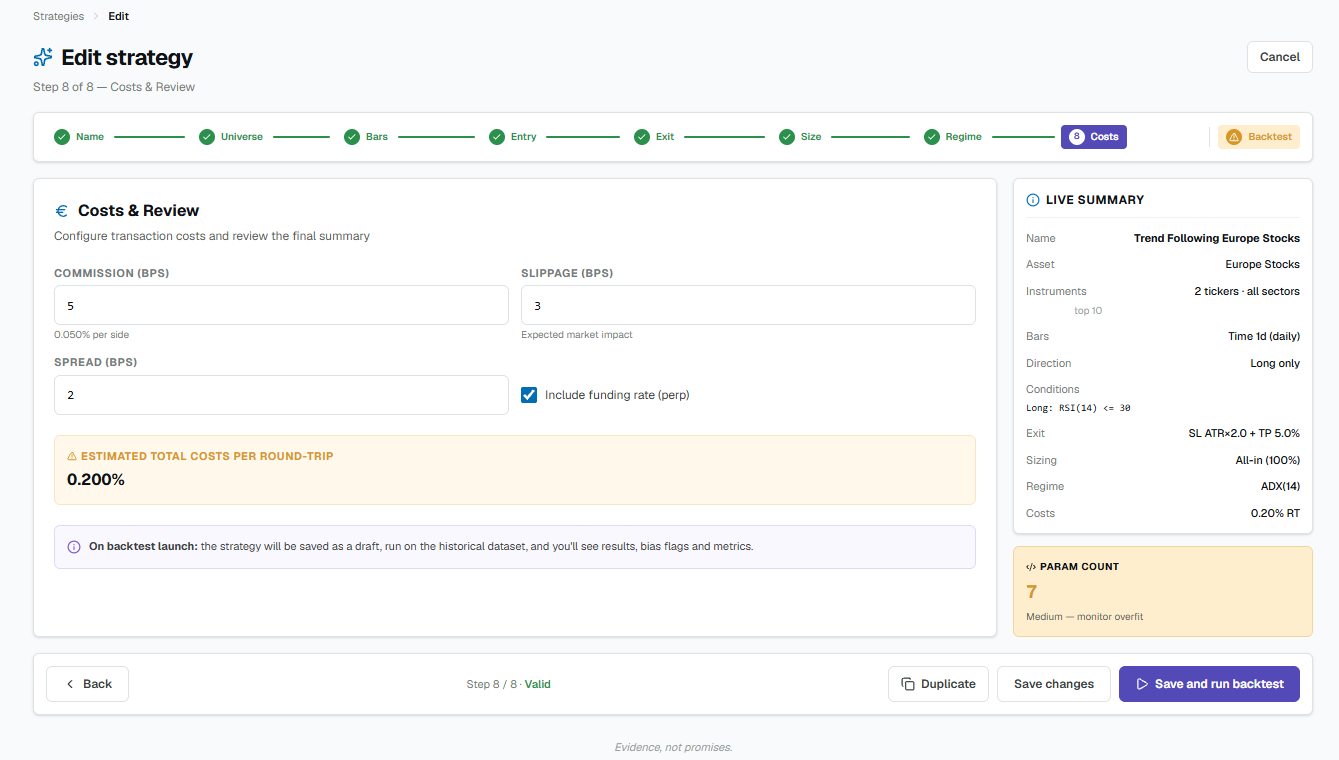
Saving and launching
Save draft creates the strategy without running the backtest. Save and launch backtest creates it and immediately runs the simulation on historical data: at the end you are taken to the results page (equity curve, metrics, trades and, depending on the plan, the advanced analyses).
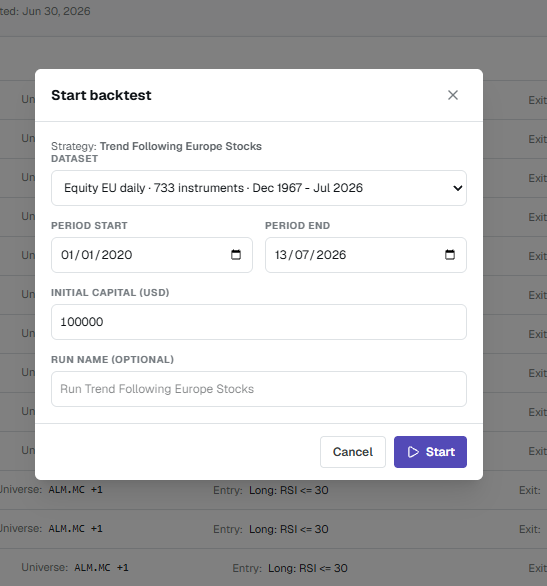
To interpret the results, see the guide How to read a backtest.