How to create a portfolio
A portfolio in Skewlab combines several components — ETFs, strategies, static allocations, bonds — with weights, and lets them evolve over time with rebalancing rules. While a strategy tests a single logic, a portfolio tests how several elements behave together: diversification, rebalancing, hedging. The wizard guides you through 8 steps.
Step 1 — Basic data
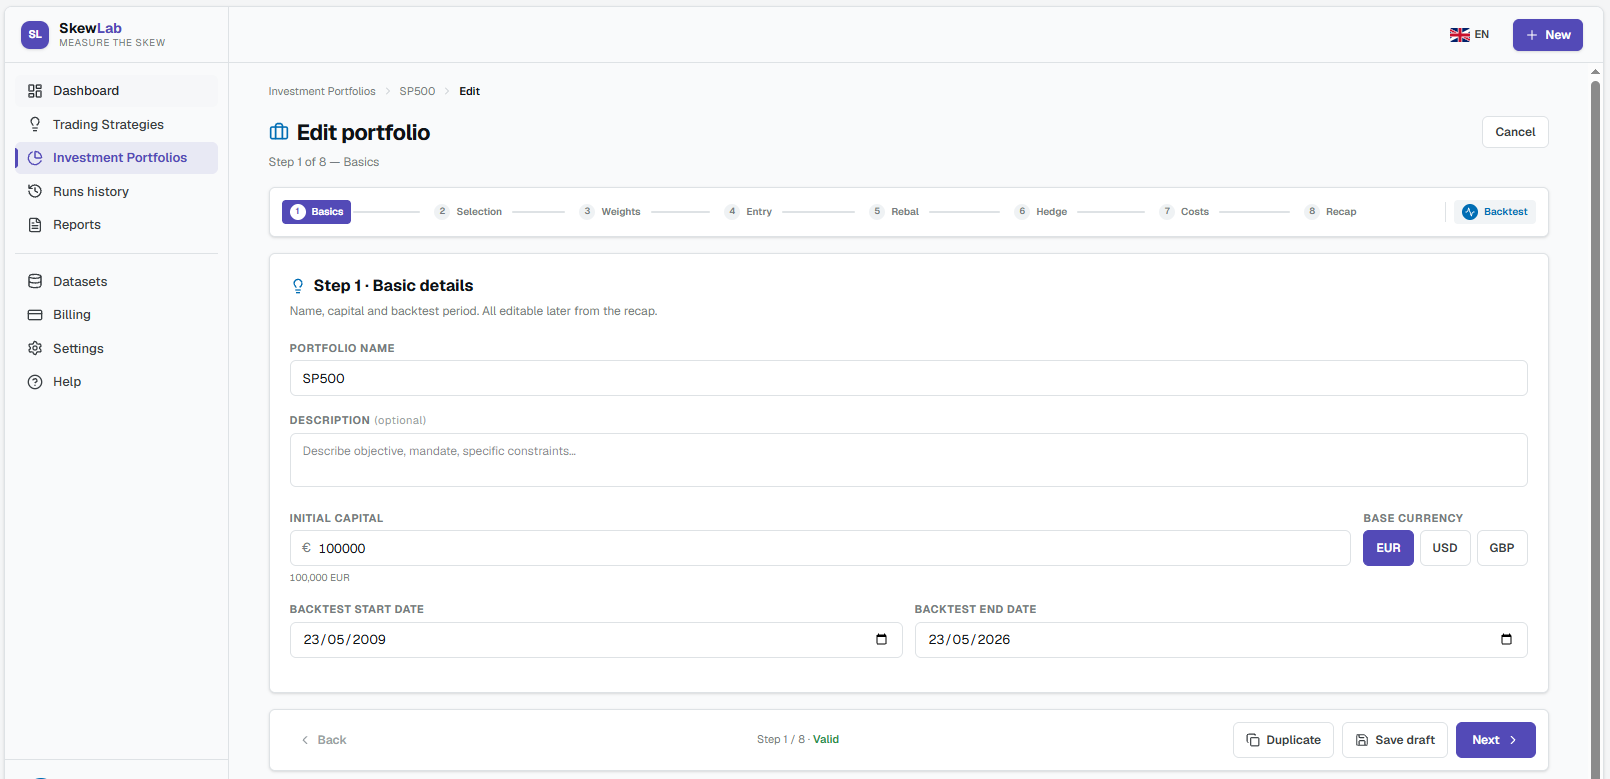
General parameters: name and description, initial capital, base currency (EUR, USD, GBP) and the backtest period (start and end dates).
Step 2 — Component selection
Choose what the portfolio is made of. Component types: ETF / Buy & Hold (held passively), Strategy (one of your existing strategies used as a component), Static allocation, Bond (ISIN). You can mix them freely.
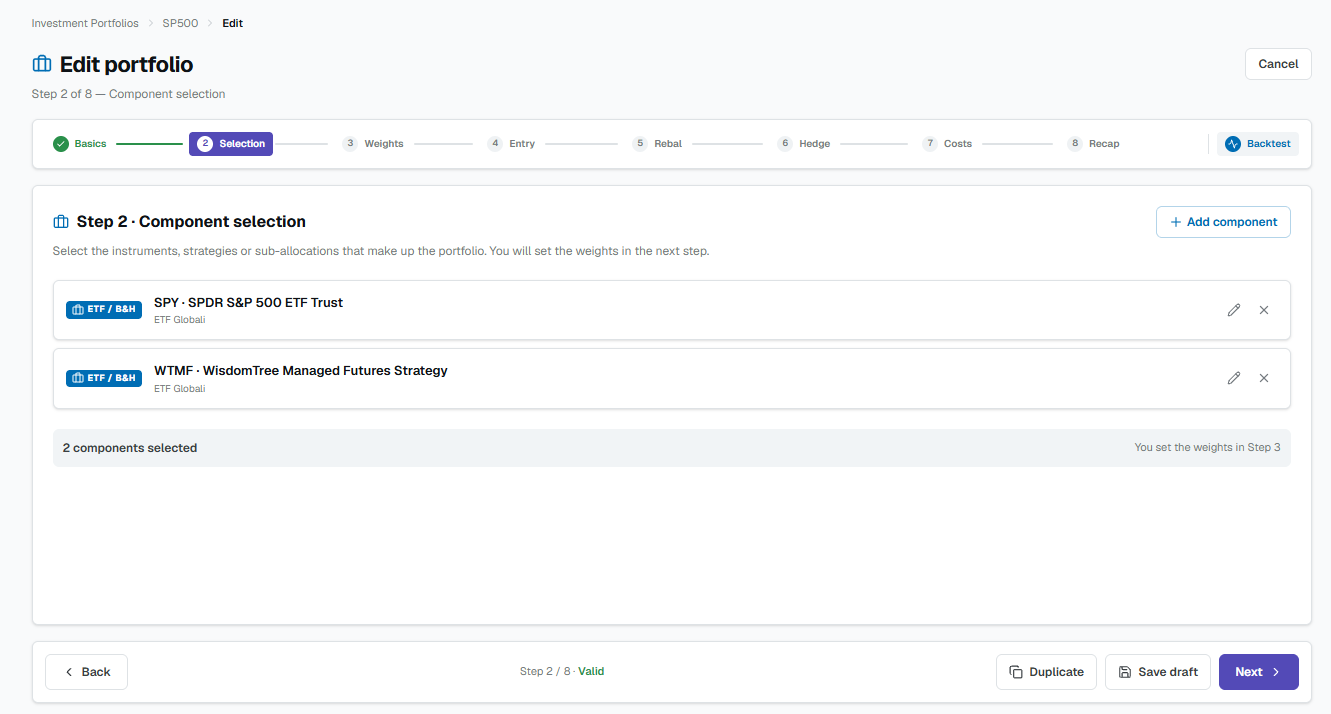
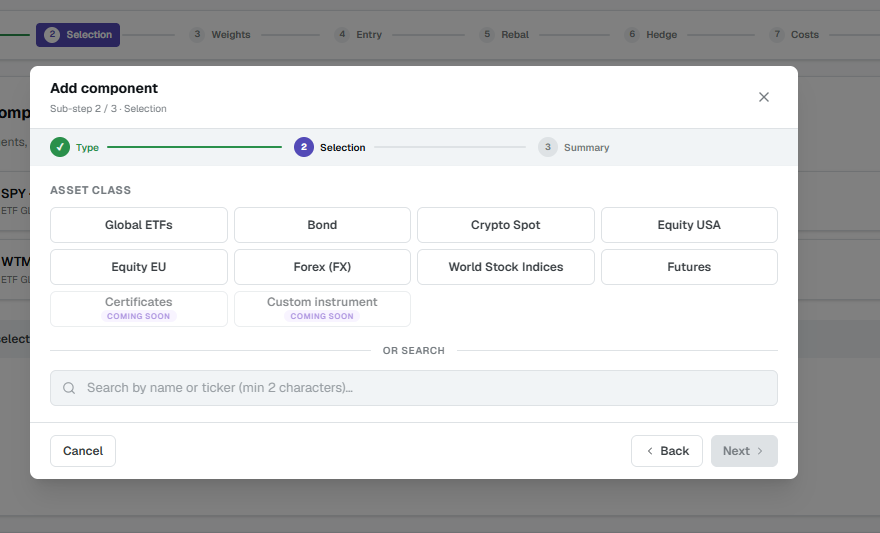
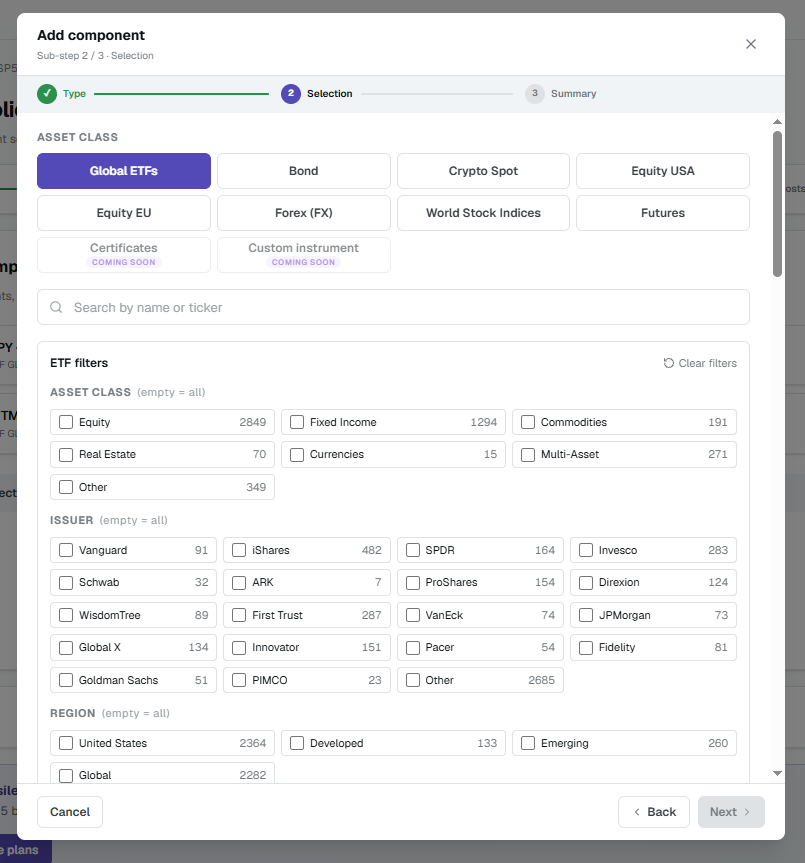
The Add component dialog walks you through it: pick the asset class (or search by name/ticker), then filter and select the specific instruments.
Step 3 — Weights
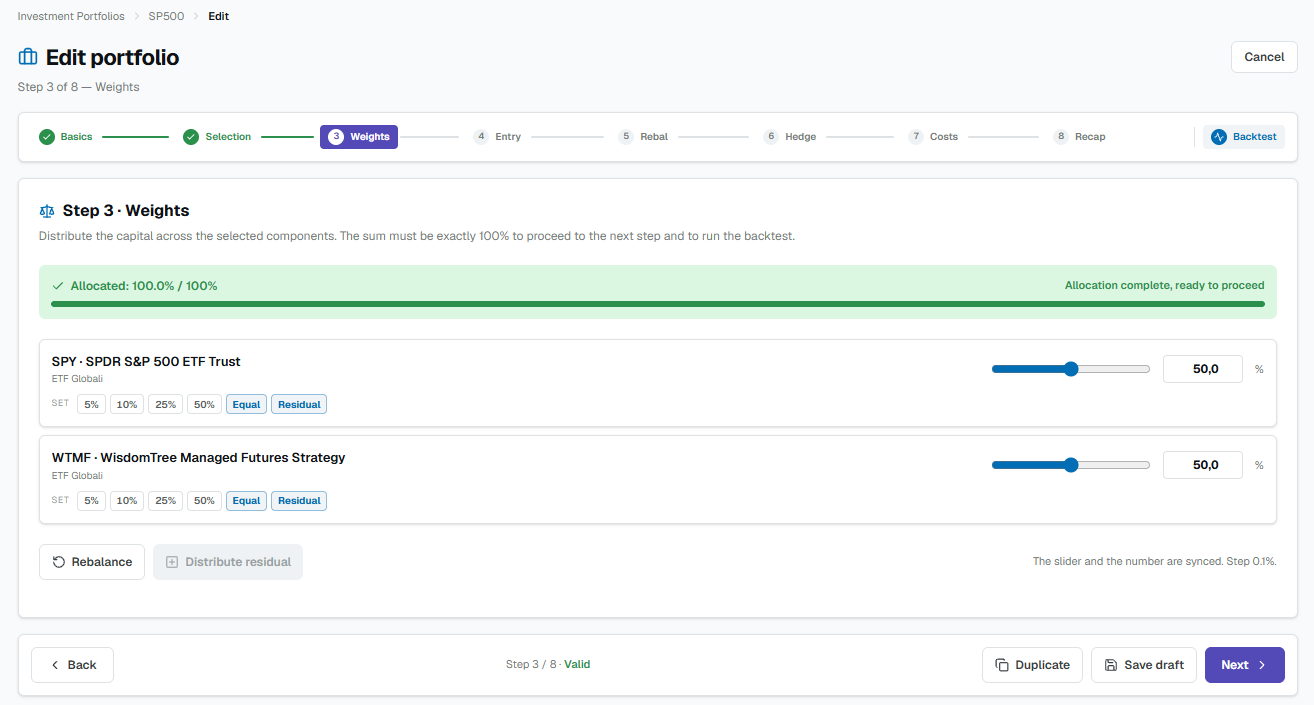
You assign each component its weight. By default the weights are equal (100/N), but you can change them manually. The weights define the initial allocation: how it evolves depends on rebalancing.
Step 4 — Entry
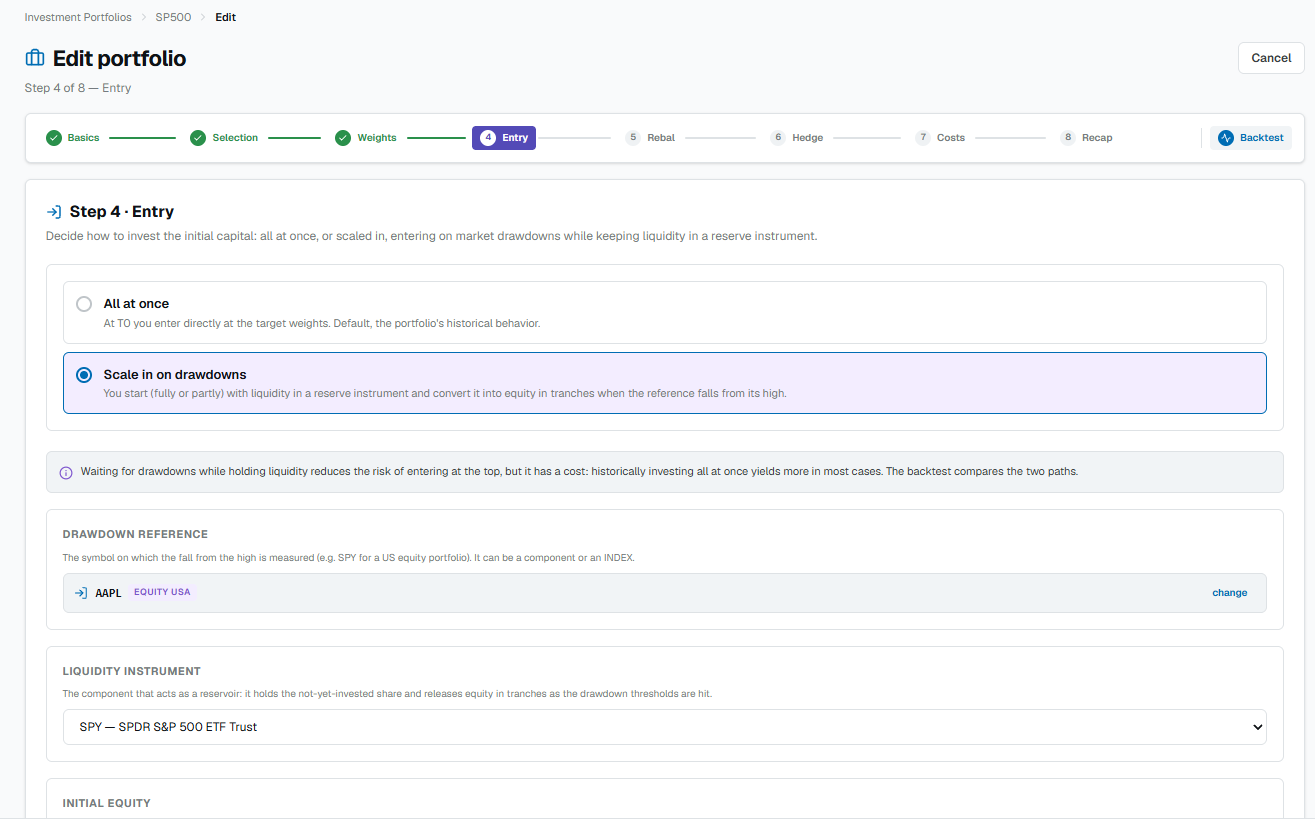
Entry conditions at the portfolio level: you can have it start all at once or activate it in tranches / when conditions are met. If you don't need particular control, standard activation is fine.
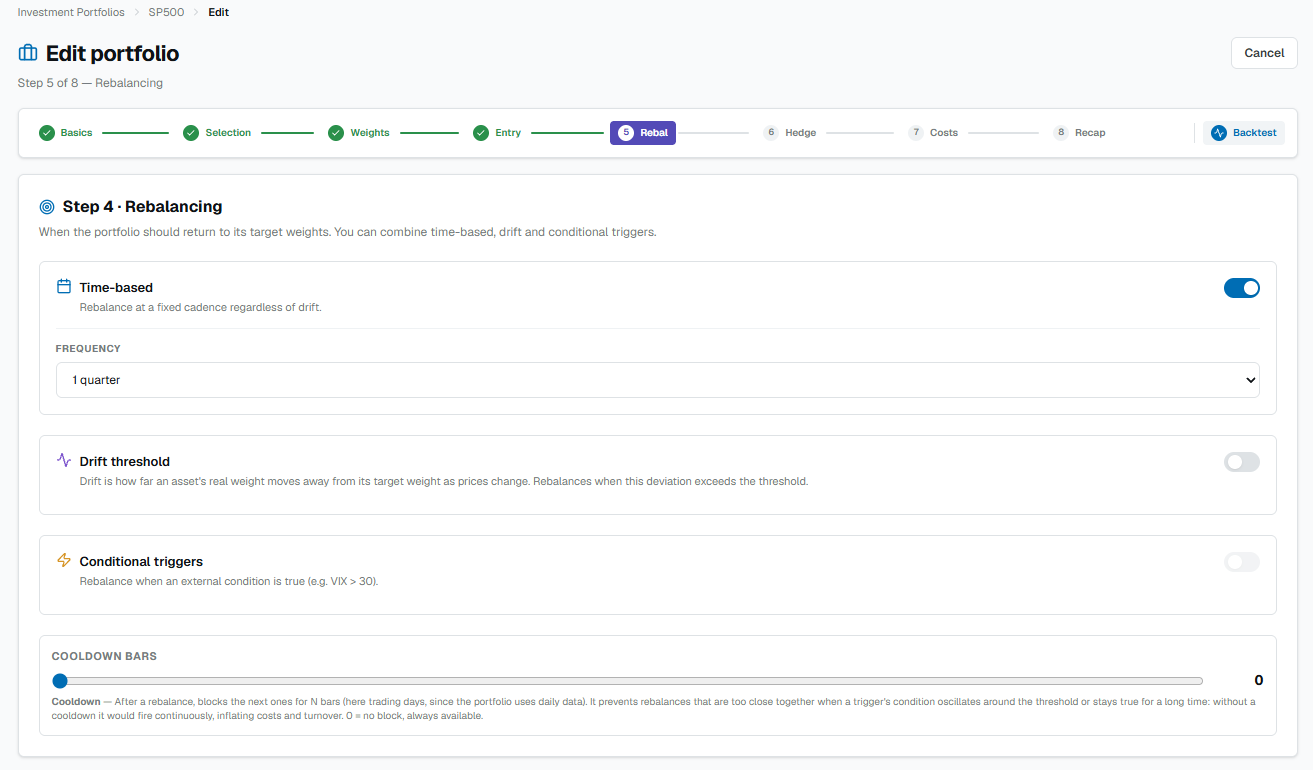
Step 5 — Rebalancing
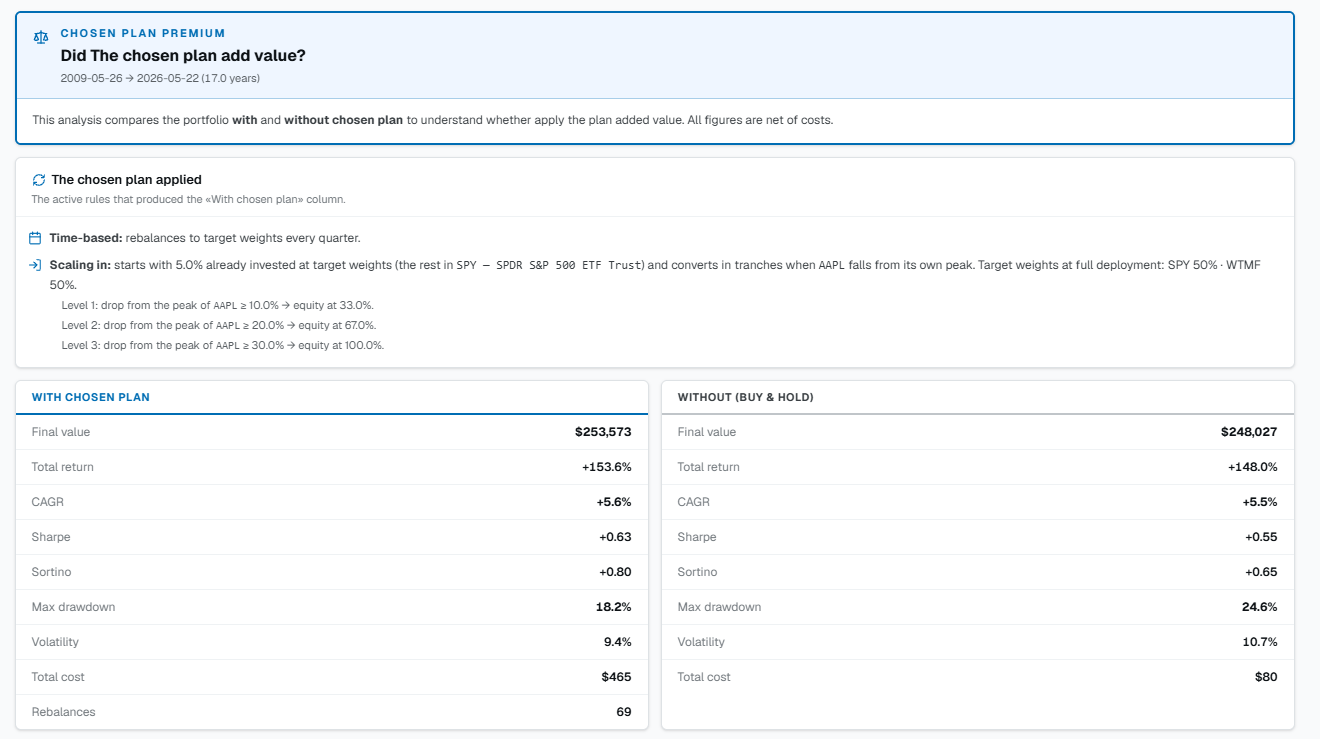
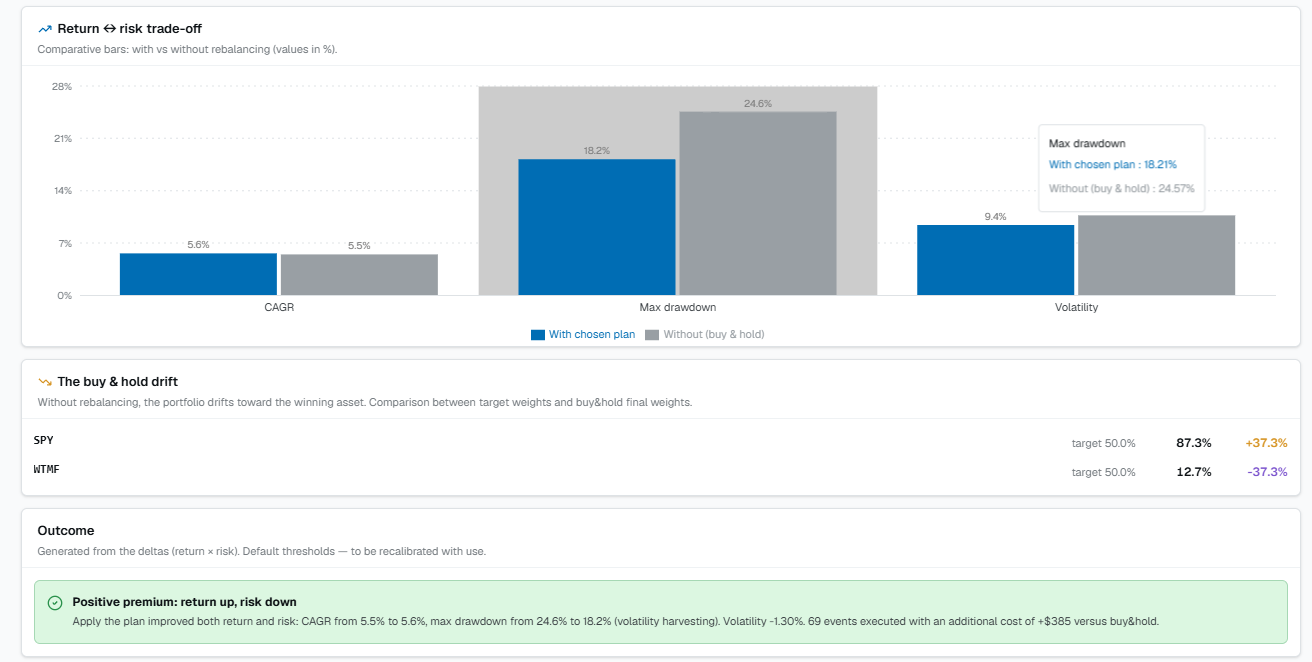
Defines how and when the portfolio returns toward the target weights. Without rebalancing the weights drift over time. The modes: Time-based (fixed cadence), Drift threshold (rebalances only when a component moves beyond a threshold — more efficient), Conditional (when a condition is met).
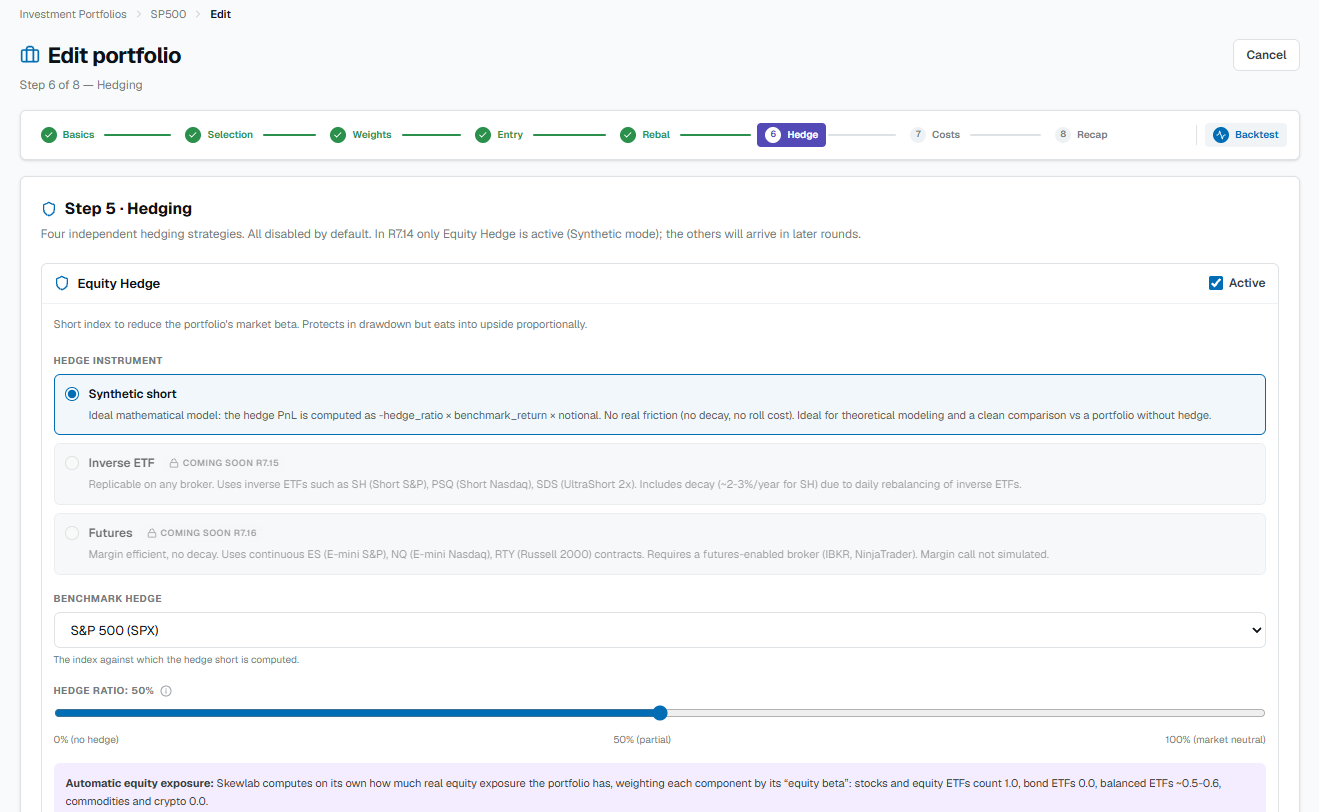
Step 6 — Hedging
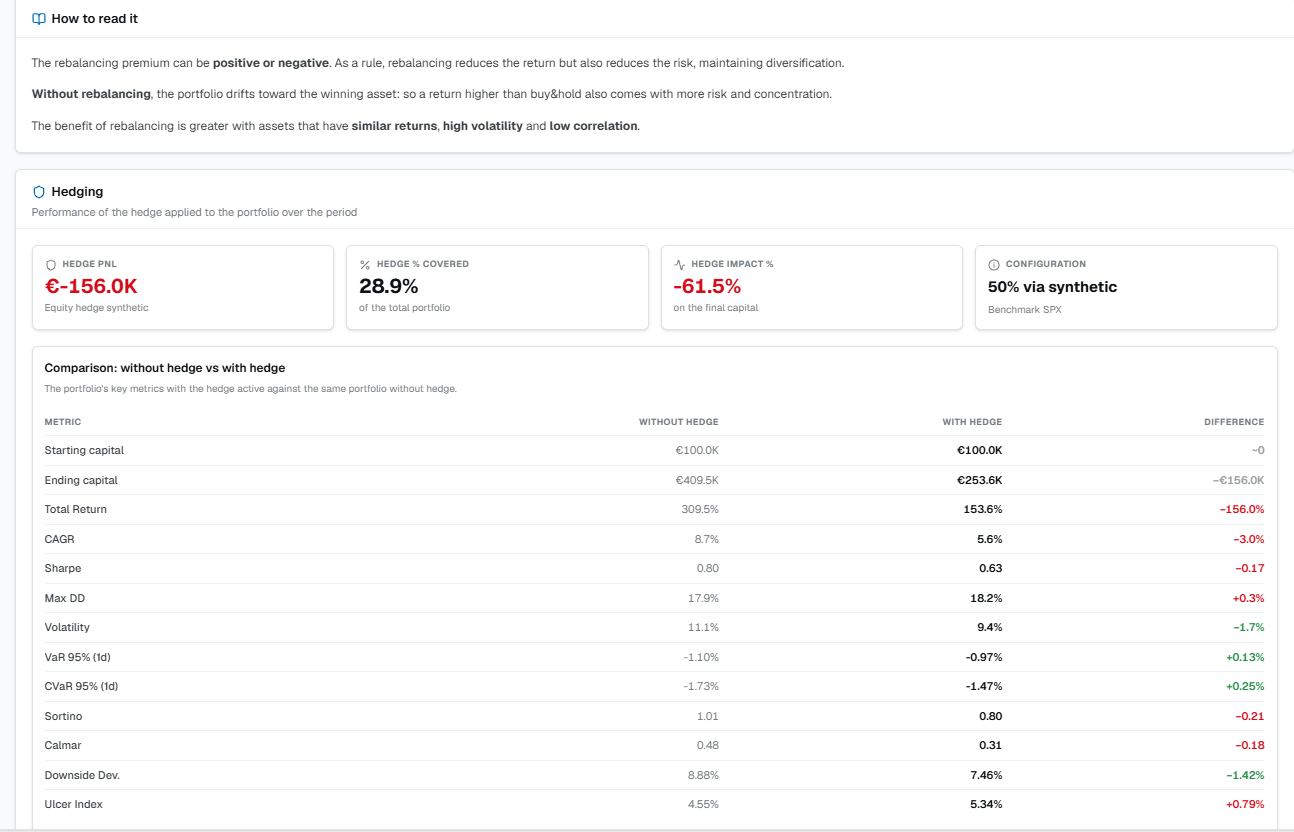
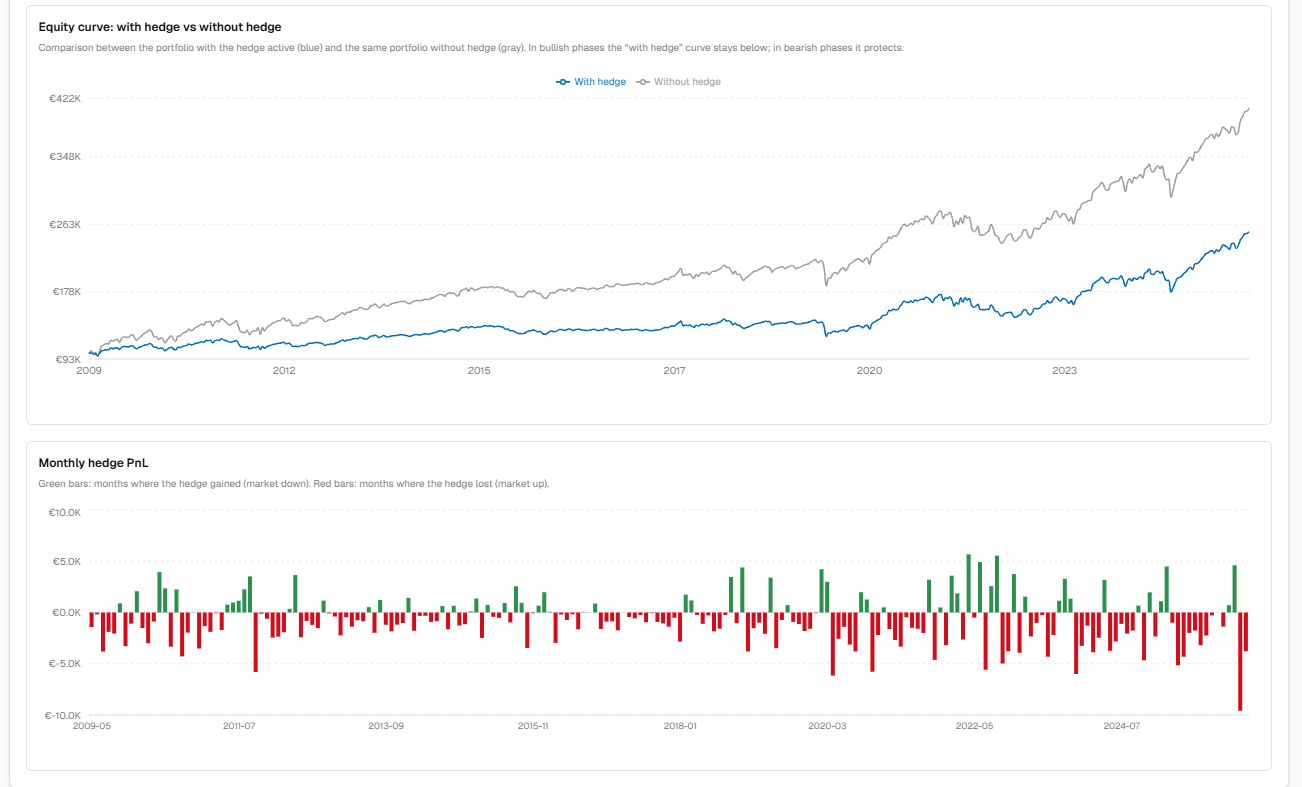
An optional step to set up a hedge for the portfolio, designed to soften losses in adverse moves (Equity hedge, Credit hedge, FX hedge, Tail hedge). If you don't need it, skip it.
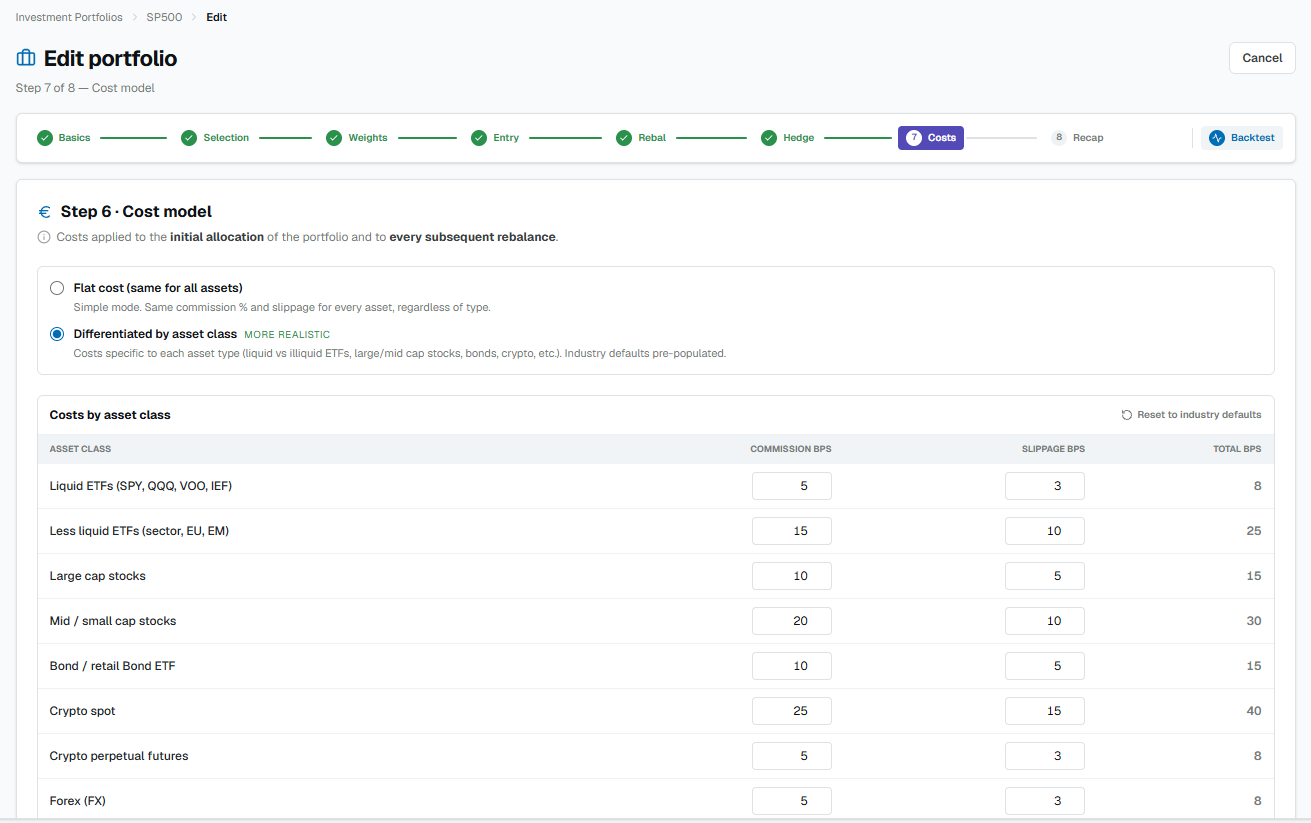
Step 7 — Cost model
Transaction costs, in two modes: flat — the same commission % and slippage for all — or per asset class — distinct values for each category (more realistic when you mix instruments with different costs). Plus an optional annual funding rate.
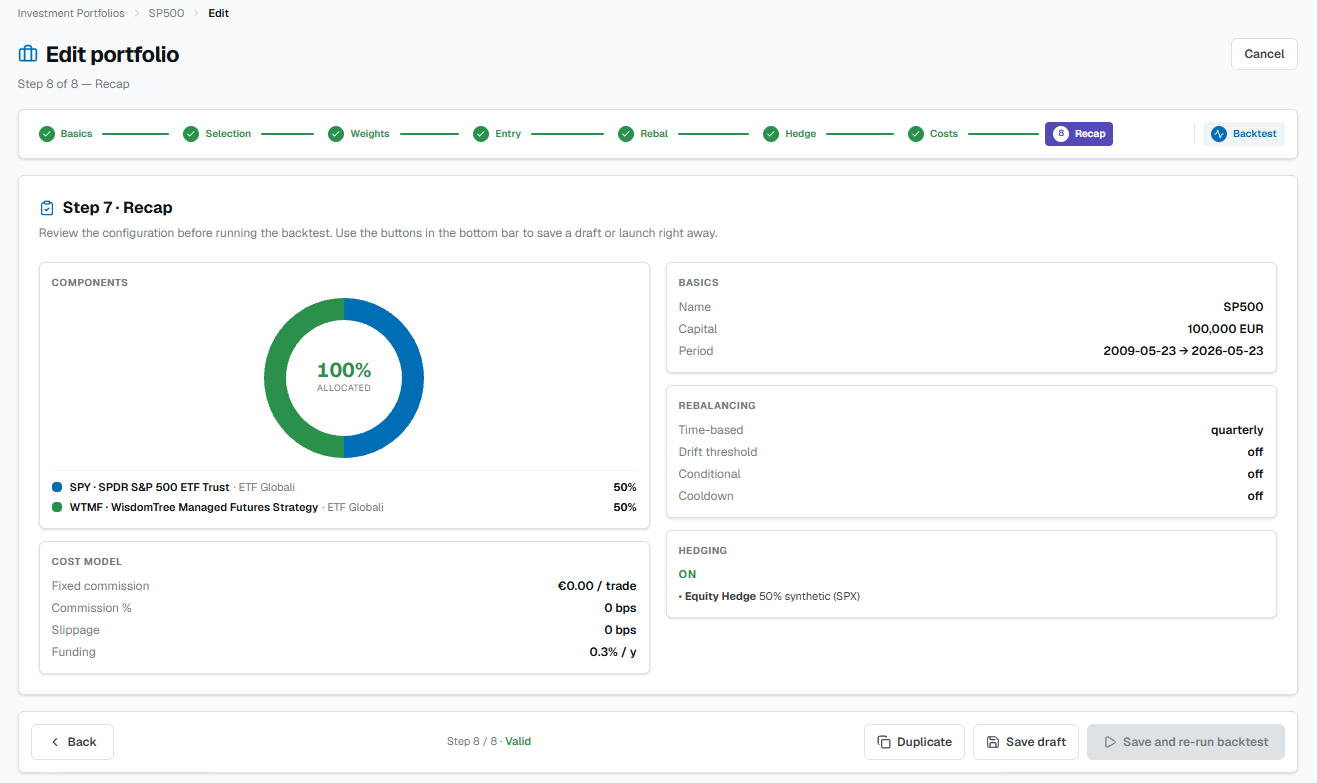
Step 8 — Summary
The full recap — components, weights, rebalancing, costs — to review before launching.
The portfolio results
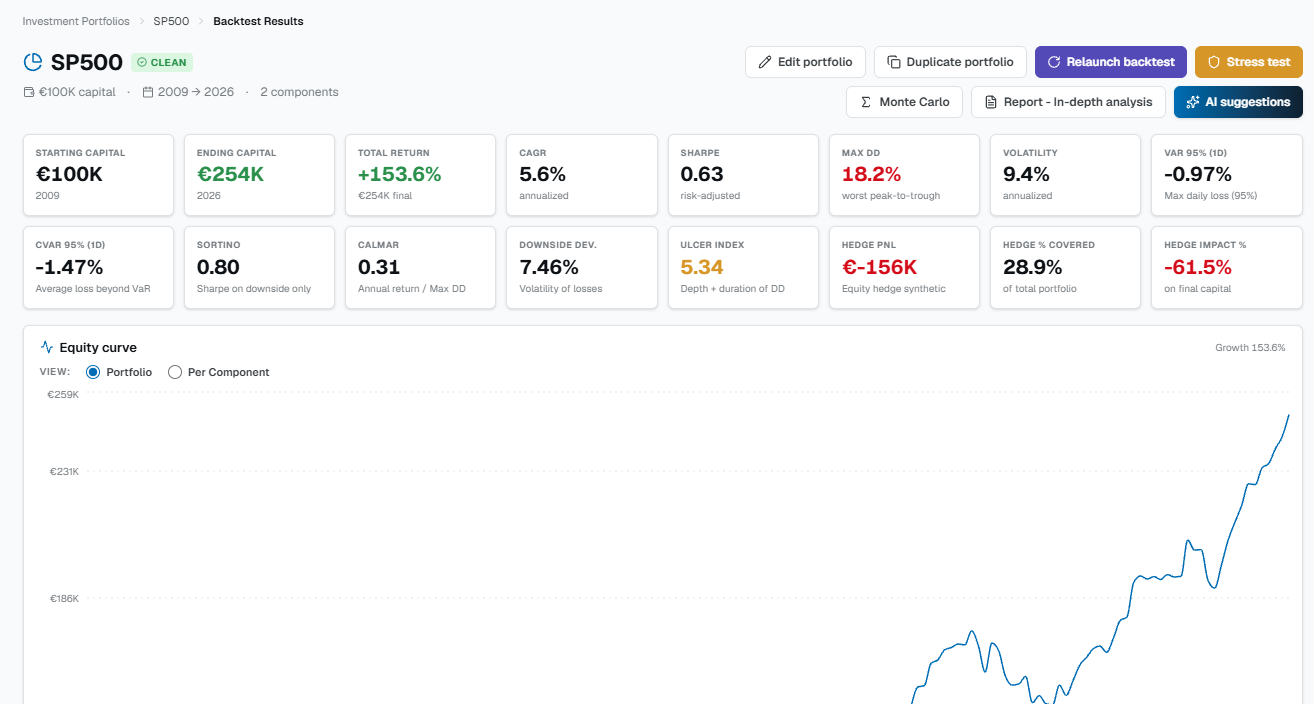
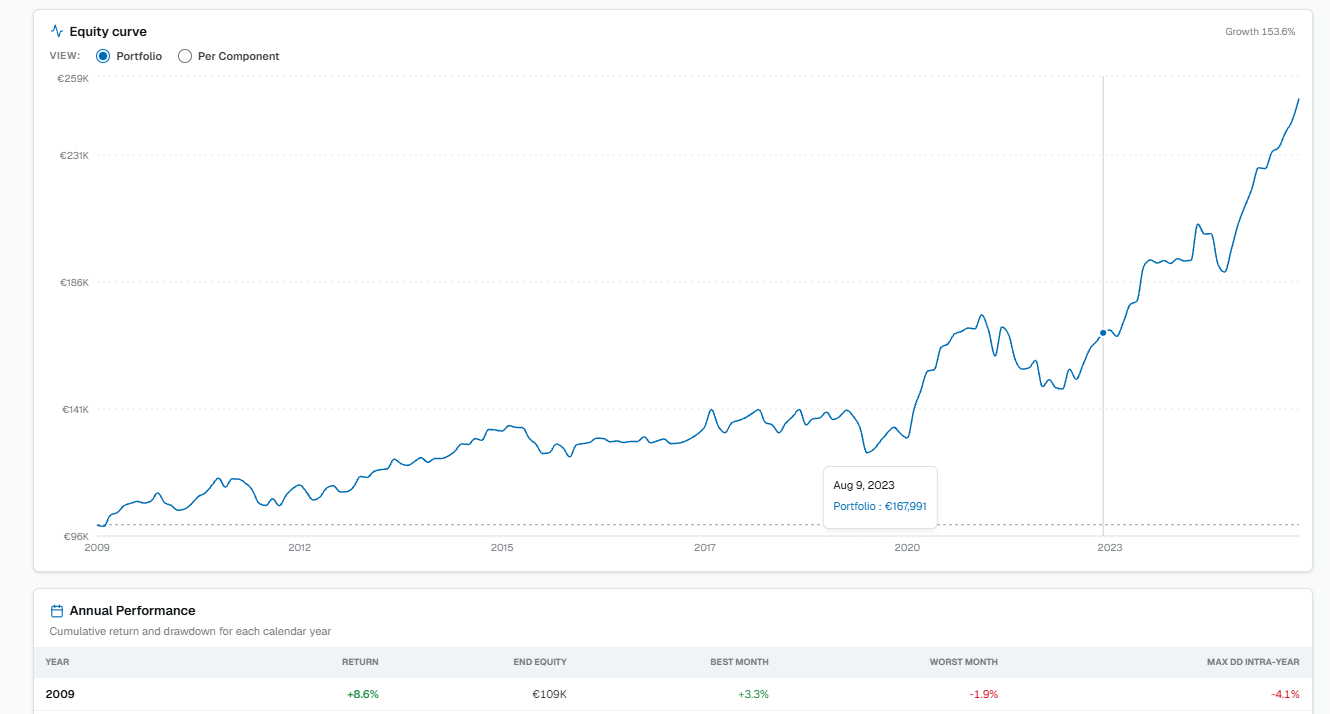
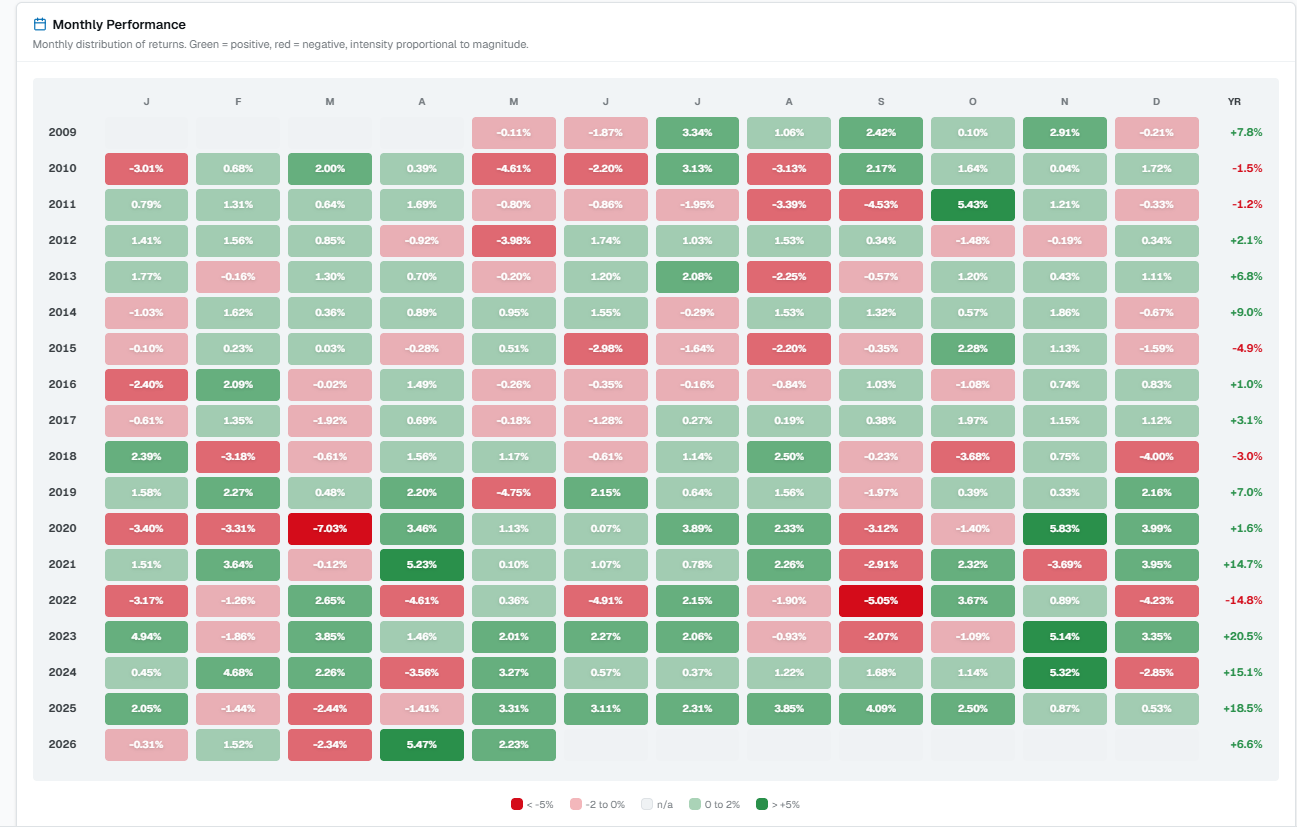
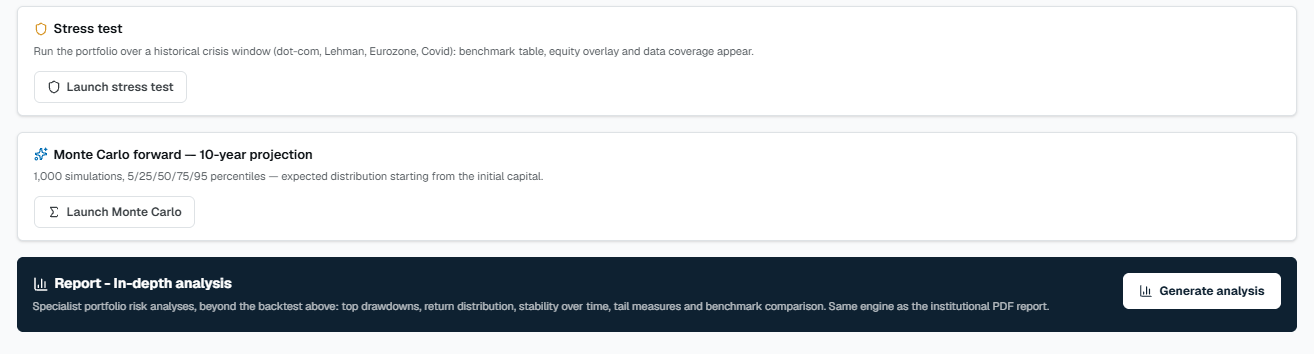
After Save and launch backtest you are taken to the results page. Besides the metrics and the equity curve (see How to read a backtest), the portfolio shows specific analyses:
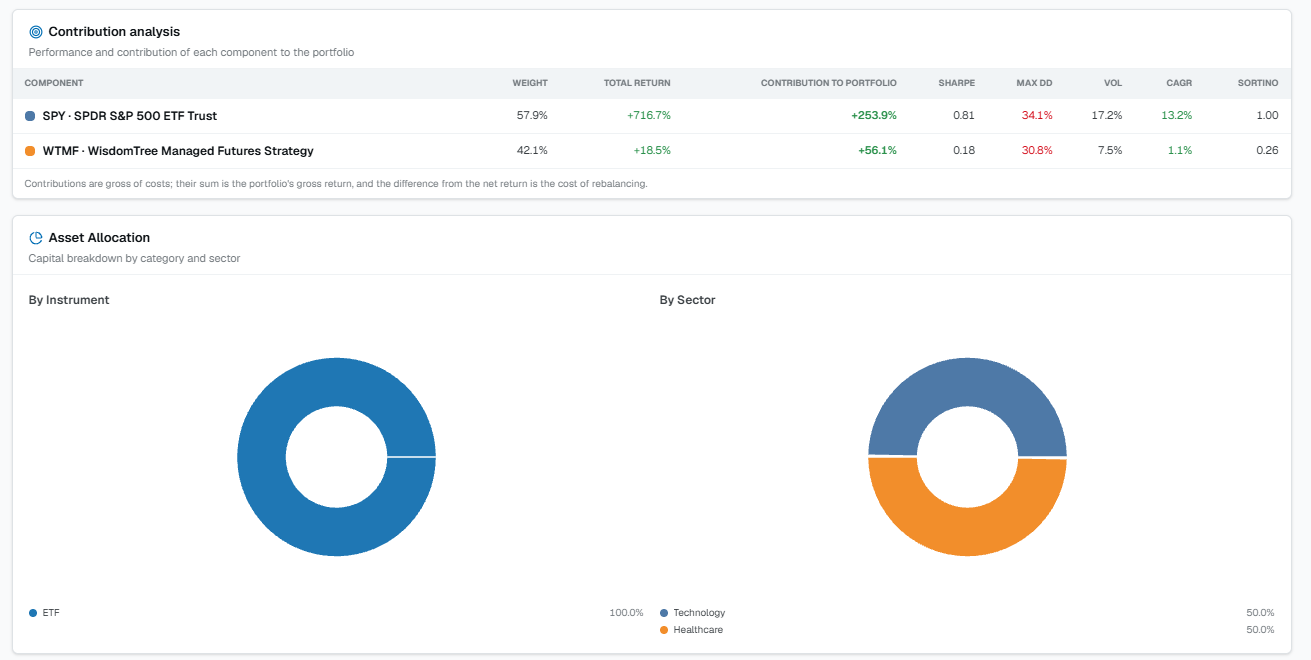
- Contribution analysis — how much each component contributed to the overall result.
- Asset allocation — the actual composition of the portfolio by instrument and by sector.
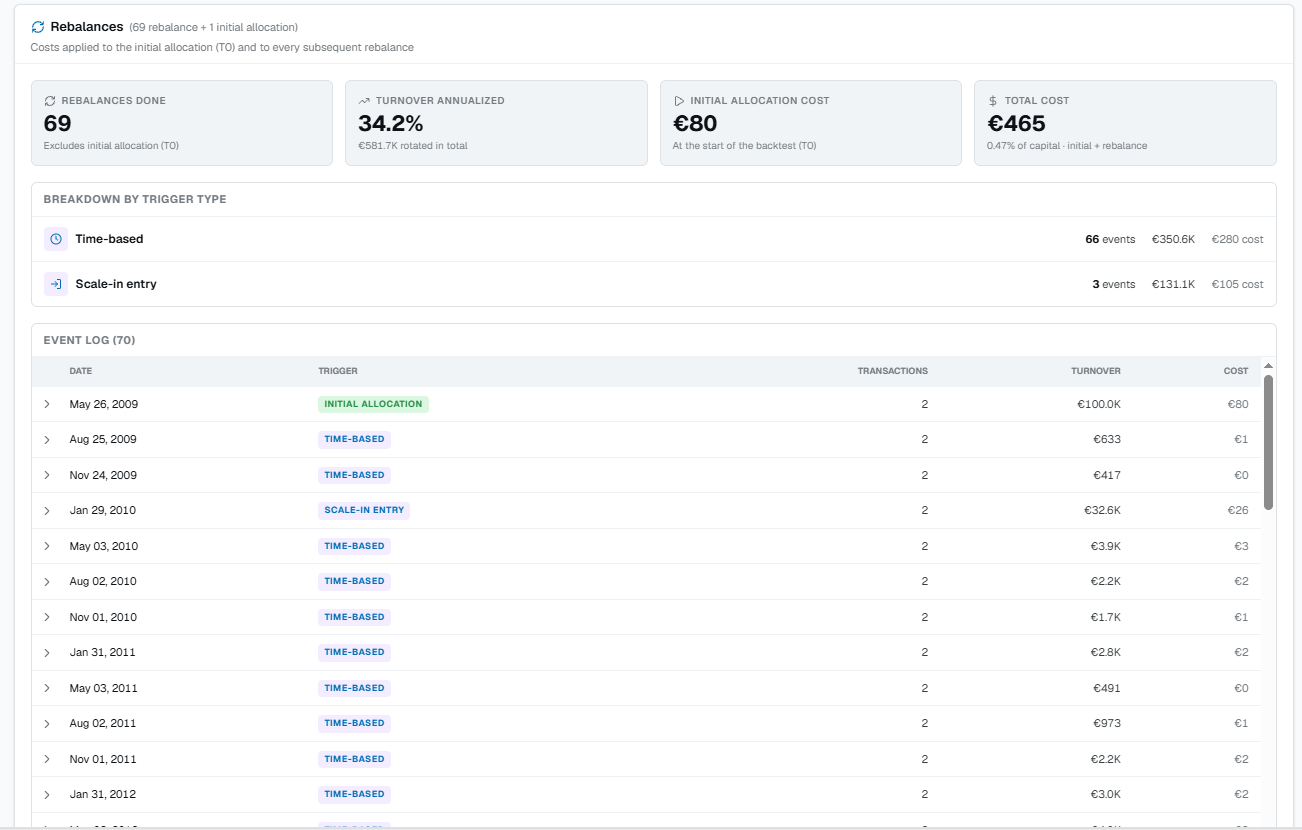
- Rebalancings — how many times and when the portfolio was brought back to the target weights.