
Alpha / Beta
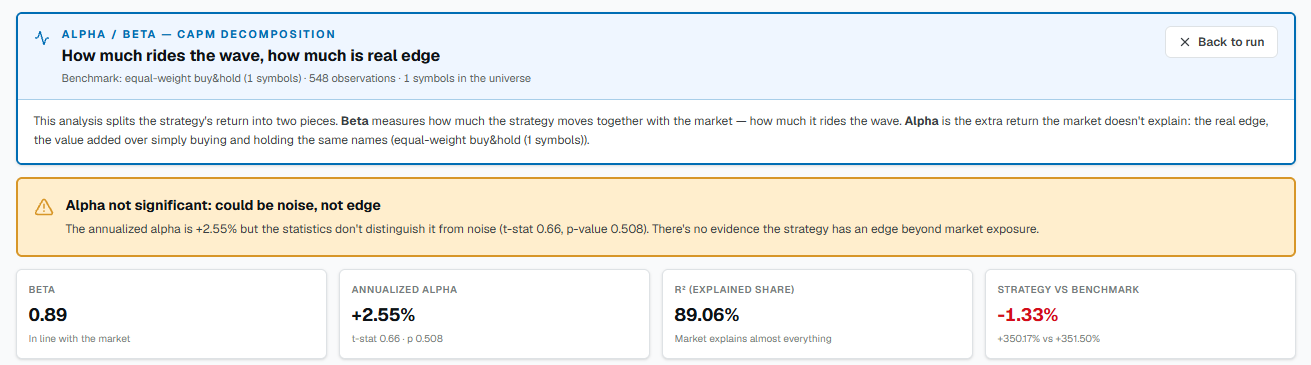
This analysis splits the strategy's return into two pieces. Beta is how much the strategy moves together with the market — how much it "rides the wave". Alpha is the extra return that the market does not explain: the true edge, the added value over simply buying and holding the same stocks.
How to read it
- Beta around 1 = moves like the market; low beta = little exposure to the market.
- Positive alpha = added value beyond the market; negative alpha = worse than the market for the same exposure.
Significance
A positive alpha on its own is not enough: it could be luck. The t-stat tells you whether it is solid. Rule of thumb: t-stat above 2 (p below 0.05) → alpha probably real; below → maybe just noise.
The benchmark comparison
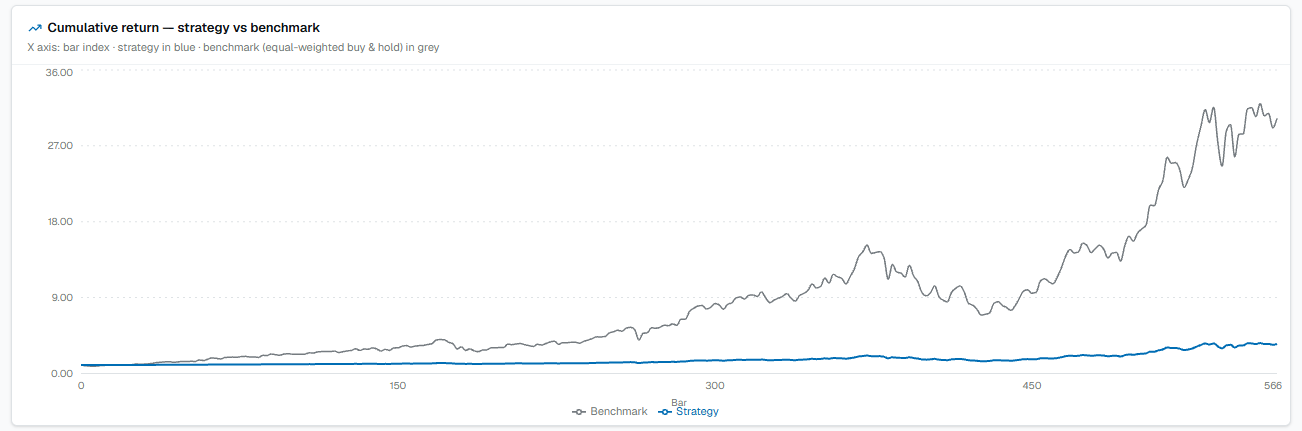
The strategy's return set against the buy & hold of the same universe directly tells you whether trading beat buying and holding.
How to read the analysis
A compact recap — beta, alpha and significance — to orient yourself among the numbers.
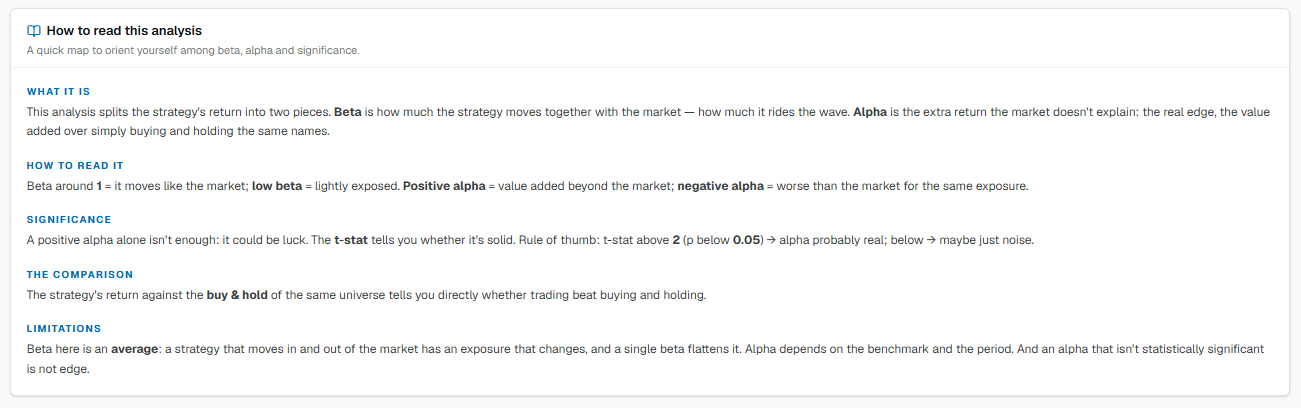
The limits. Beta here is an average: a strategy that enters and exits the market has an exposure that changes, and a single beta flattens it. Alpha depends on the benchmark and the period. And an alpha that is not statistically significant is not edge.